
Chapter 23 10/04 WTI: "Downward Impulse Waves" Structure Is About to Come to an End and Reverse?
As Saudi Arabia and Russia reiterated that they will continue to cut production until the end of the year, oil prices were dragged lower by a sell-off in global financial markets.
Fundamentals
The OPEC+ Joint Miniature Monitoring Committee held a video conference on Wednesday, and Saudi Arabia and Russia announced plans to continue to implement additional restrictions until December. Nevertheless, due to a series of factors, WTI crude oil fell below US$86.00/barrel in a day, a decrease of 3%.
At the same time, in the U.S., the market will usher in the release of inventory data in the context of the rapid decline of crude oil inventories, including the storage center in Cushing, Oklahoma. According to informed sources, the inventory of the center increased slightly last week, but it was flat nationwide.
Additionally, flows from a key U.S. pipeline declined this week. Crude oil prices have risen since mid-June as OPEC+ supply cuts have led to a tightening of the market, inventories have declined, and key time spreads indicate increased competition for spot crude. Nonetheless, the rise in recent sessions has met resistance as investors worry that the Federal Reserve may not finish raising interest rates and that a stronger USD will make commodities more expensive for most buyers.
In addition, the U.S. Dollar Index (USDX) is at a high level this year. Judging from the actions and remarks of central banks and their efforts to curb inflation, the USDX is brewing a strong rebound, which will continue to plague all markets, including commodity markets.
Finally, the crude oil base weakened as traders once again considered the weak demand outlook. Market investors may also reduce their positions before the release of non-farm payroll data on Friday, as this may set the tone for the U.S. borrowing costs and recession risks. At the same time, Saudi Arabia and Russia have confirmed to cut output at the end of the year, so crude oil prices may gain some support in the further decline.
Technical Analysis
Although WTI crude oil has been in selling mode recently, it may be able to draw some bullish energy from these long-term inflection points.
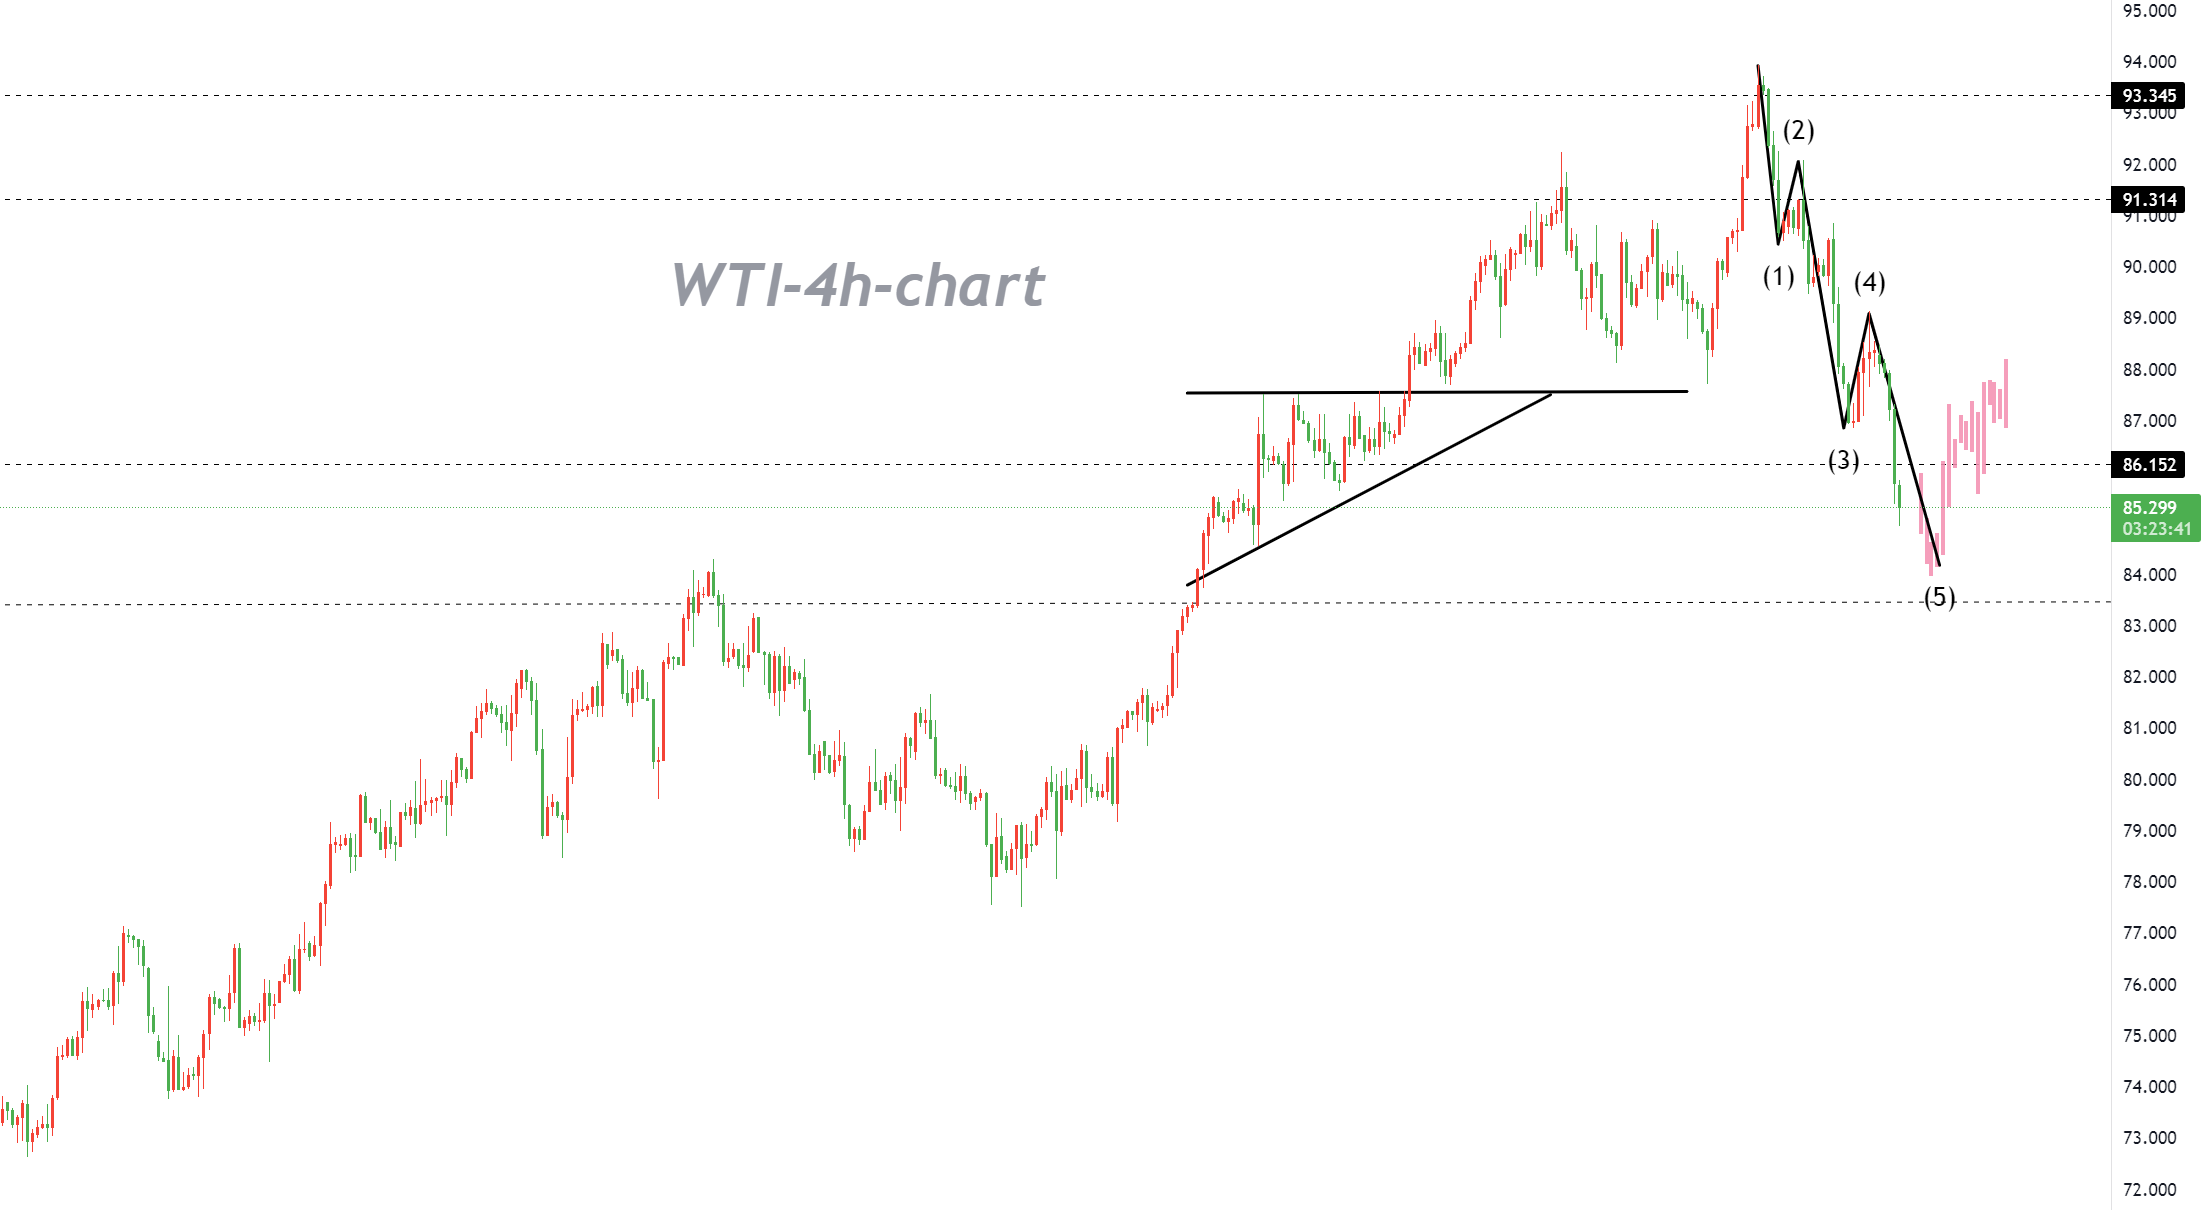
As can be seen in the 1D timeframe, the higher and lower points of crude oil prices since July are supported by an upward trend line.
Another support test is underway, and Fibonacci retracement tools show that bulls may wait to enter an upward trend. The price has already supported US$85.50 in the early stage of testing, and may also fall below the integer threshold of US$85.00, causing the price to slide further to the bottom line of US$84.00, because falling below this level may confirm that the downward trend is underway.
However, technical indicators seem to favor further gains. The 100 SMA just broke above the 200 SMA, suggesting that the path of least resistance is to the upside. If any Fibonacci retracement can be used as support, crude oil could rally to swing highs of US$90.00/barrel or higher.
Stochastic is falling to reflect selling pressure, but the oscillator is in the oversold zone, suggesting that downward momentum has run out. Higher prices will confirm that the bulls are ready to return. It is recommended to buy low and sell high.
Trading Recommendations
Trading direction: Long
Entry price: 84.50
Target price: 92.20
Stop Loss: 83.00
Deadline: 2023-10-18 23:55:00
Support: 85.20, 84.57, 83.36
Resistance: 86.83, 88.20, 88.93


