
Chapter 59 10/30WTI: Crude Oil May Record Similar Physical Open and Close Prices This Month as Last
Summary: Bearish pressures have weighed on crude oil prices, with the triangle pattern failing to trigger a bullish response. Prices remain below $84.30 and may continue to decline towards the $83.00 range. Currently, investors can only await the monthly close to further confirm the direction of crude oil prices.
Fundamentals
As market demand softens, Saudi Arabia may pause its six-month streak of raising crude oil prices for sale to Asia, citing declining refining profit margins in the Asian region, which have weakened demand for spot crude oil.
Based on a survey of seven traders and refiners, it is expected that Saudi Aramco will keep December pricing for Arab Light crude to Asia unchanged.
Since June, Saudi Arabia has consistently raised export prices each month due to healthy demand and diminishing inventories. Despite a recent uptick in WTI crude oil prices following the Hamas attacks on Israel this month, softness in the global spot market has emerged as refining profits for turning crude oil into fuel have declined while shipping costs have surged.
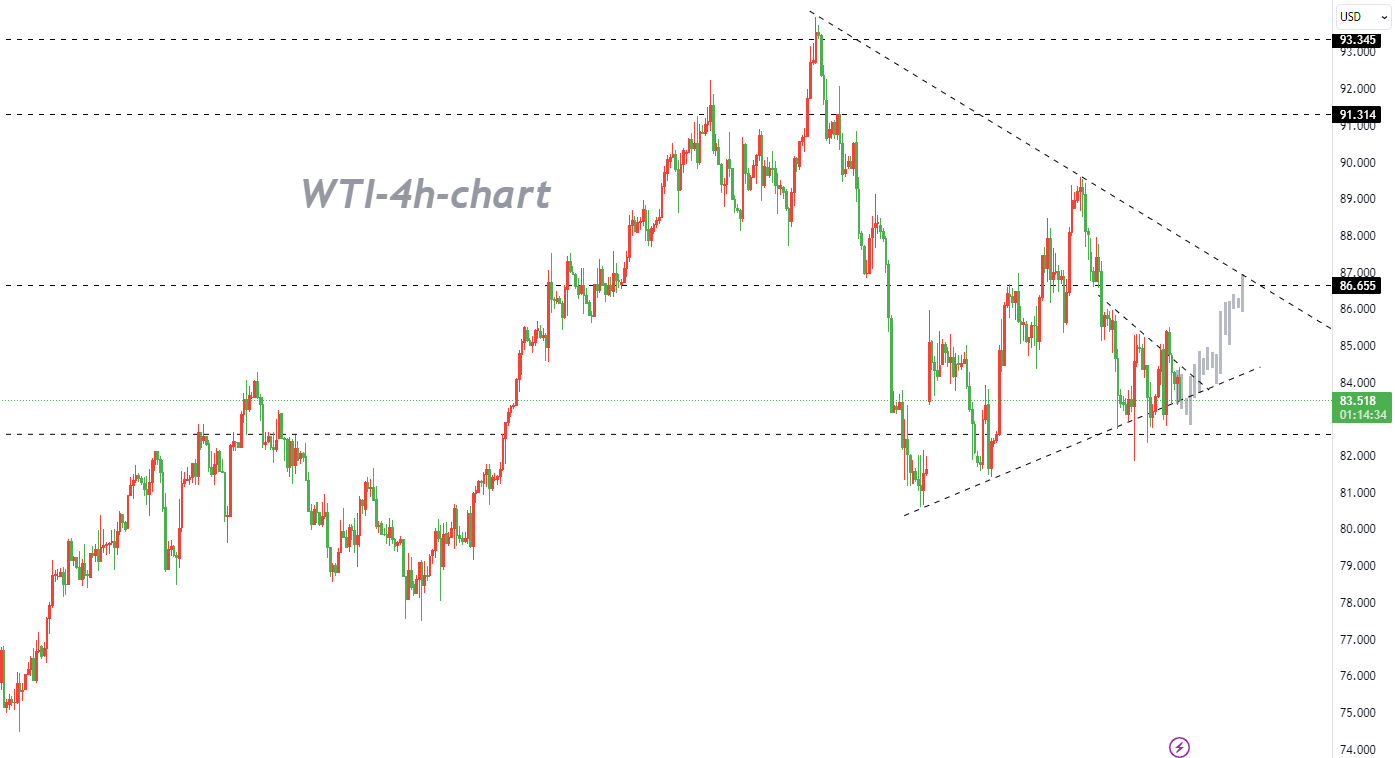
WTI crude oil prices currently exhibit an overall neutral downward bias, suggesting a potential move from the first resistance at $85.53 toward the first support at $82.66.
The next support at $82.66 is considered significant, aligning with overlapping support levels, making it a potentially strong support zone. Furthermore, the third support at $80.50 is also marked as overlapping support, reinforcing the potential support area. Breaking below it could send crude oil prices sliding to $77.41.
On the resistance front, the first resistance level is at $85.53, with overlapping resistance at $86.98. This resistance level coincides with the 50% Fibonacci retracement, making it a potent potential hurdle for upward price movement. There is also an intermediate resistance level at $89.57, marked as overlapping resistance, which could further hinder price gains.
Technical Analysis
From a monthly chart perspective, after the close tomorrow (the last trading day of the month), crude oil prices may record a monthly closing price with a lower shadow (bearish candlestick) entity, with a target range of $83.10 (close to last month's opening price). This pattern will echo the bullish candlestick with an upper shadow recorded for the previous month. This suggests that the volatility in the current and the following trading day will not be significant, indicating a predominantly oscillating downward movement.
However, considering the structure of four consecutive months with bullish candlestick closes, November may exhibit a bearish engulfing pattern. In this scenario, the bears would first need to break through the critical bullish support at $80.50, followed by the second support at $77.41, and eventually reach the target of $74.30.
Nevertheless, in the short term, due to the absence of a breakthrough in prices and the crowding of the upward or downward slopes of the time cycle, the bearish momentum is not particularly strong. Prices may continue to move higher after forming a bottom, potentially reaching the downward resistance around the $87.00 range before resuming the downward trend. In terms of trading strategy, it's recommended to consider buying the dips near key support levels.
Trading Recommendations
Trading Direction: Long
Entry Price: 83.00
Target Price: 82.00
Stop Loss: 80.50
Valid Until: 2023-11-10 23:55:00
Support: 82.50, 81.43, 80.64
Resistance: 84.41, 85.99, 87.88


