
Chapter 60 10/30GBPUSD: Fundamentals Still Potential Drivers for Asset Sell-Off
Summary: The GBPUSD experienced volatile fluctuations last week due to disappointing data released in the UK. The asset remained within a bearish zone, closing near $1.2113, hindered by the stagnation of the UK economy.
Fundamentals
The British pound faced heavy selling pressure last week as a result of disappointing UK data.
The preliminary Purchasing Managers' Index (PMI) released on Tuesday pushed the pound down, with UK business activity contracting for the third consecutive month. Both the services and manufacturing PMI surveys indicated a lack of development in October, remaining in contraction territory. This heightened concerns about the ongoing decline in the UK economy, reducing investor interest in the pound.
The UK unemployment rate for June to August was also released on Tuesday. The UK unemployment rate stood at 4.2%, an increase of 0.2% from previous data. The gradual rise in the unemployment rate intensified concerns about labor market slack in the UK.
On Thursday, the Distributive Trades Survey for October, released by the Confederation of British Industry (CBI), came in at -36, a significant drop from the previous month's -14. The deterioration in the retail sector's health, driven by concerns about living costs and high inflation continuing to suppress consumer spending, led to a decline in expectations for further interest rate hikes by the Bank of England (BoE).
As the week drew to a close, the sentiment for the British pound remained low, with investors expecting the BoE to maintain interest rates unchanged.
Meanwhile, the US dollar experienced fluctuations last week as investors reacted to new data.
The preliminary PMI data for October was released on Tuesday, showing strong performance in both manufacturing and services sectors, exceeding expectations, which boosted the US dollar.
GDP data released on Thursday revealed a sharp increase in the US economic growth rate in the third quarter, jumping from 2.1% in the second quarter to the current 4.9%. Positive GDP and PMI data confirmed the strength of the US economy. However, the significant surge in economic activity has limited the potential for a US dollar increase in the context of improved risk appetite.
On Friday, the Fed's preferred inflation gauge was published. The core Personal Consumption Expenditures (PCE) Price Index for September matched expectations at 3.7%, a slight decrease from the previous month. The US dollar remained relatively calm and traded within a narrow range for the rest of the day.
Looking ahead to this week, the GBPUSD exchange rate will be driven by the interest rate decisions of the Fed and the BoE on Wednesday and Thursday, respectively.
The market currently expects the Fed to announce its highly anticipated interest rate decision. US rates are expected to be maintained at 5.5%, and the potential for unchanged rates may weaken the US dollar. However, the recent surge in the US economy suggests that the Fed may have more room for rate hikes, potentially bolstering a hawkish stance and the US dollar.
Similarly, the Bank of England will release its rate decision on Thursday, expected to remain at 5.25%. In recent weeks, the bleak economic outlook has weakened expectations for rate hikes, and many investors anticipate that the BoE will keep its current rates unchanged at this week's monetary policy meeting. In such a scenario, the British pound may struggle to gain investor interest.
Technical Analysis
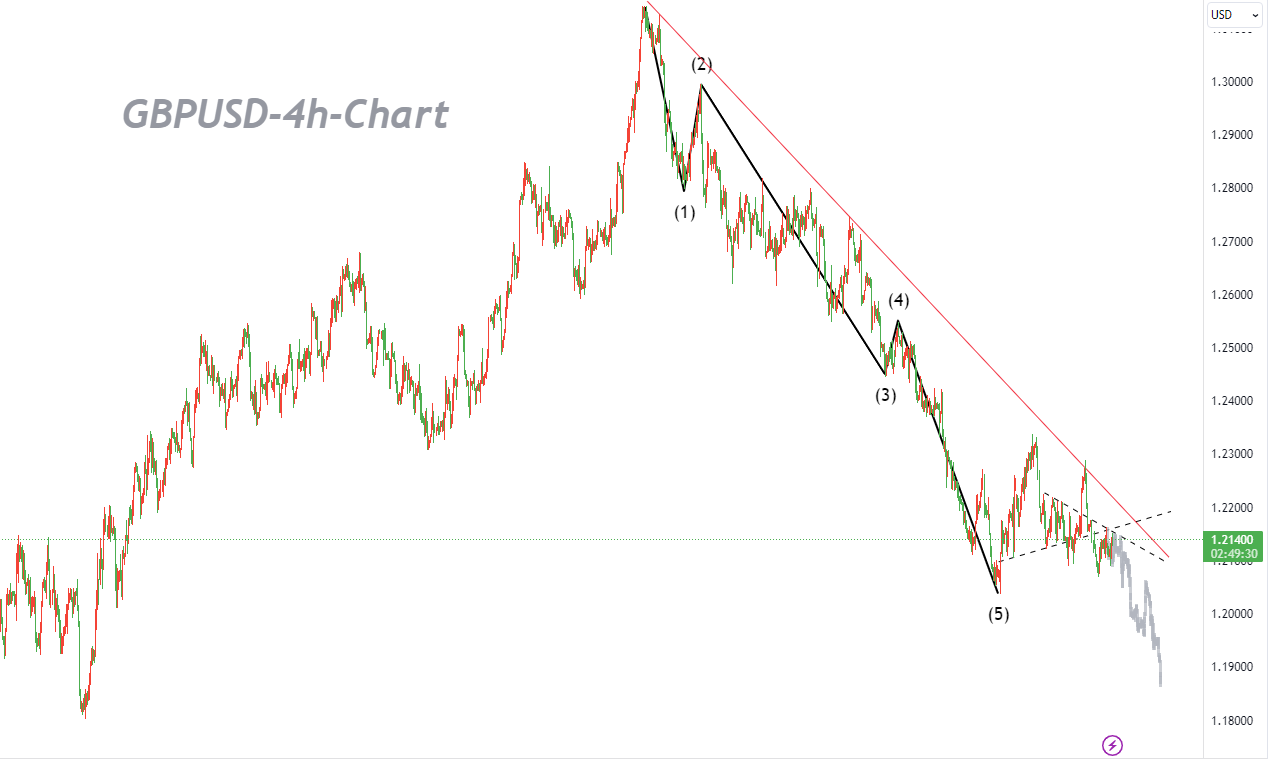
GBPUSD continues to trade in the lower range without a clear direction in the new week, maintaining a neutral bias during the day. Previously, we had explored whether this asset was bottoming out; however, with the passage of time and the lack of significant upward momentum, we have shifted our previous bottoming bias, believing that the outlook for this asset remains bearish due to the intact resistance at 1.2336.
On the downside, a break below the 1.2036 level would resume the overall downtrend that started from 1.3141, finding support around the 1.1801 level. Nonetheless, a breakthrough at 1.2336 would shift the bias back to the upside, with the target testing the 1.2458 range, which is the 38.2% Fibonacci retracement of the range from 1.3141 to 1.2036.
From a larger perspective, the decline from the medium-term top at 1.3141 could still be a retracement in the upward trend from 1.0351 (the 2022 low). However, the risk of a complete trend reversal is rising. Continued breaking below the 38.2% Fibonacci retracement level at 1.2075 for the range from 1.0351 to 1.3141 will pave the way for testing 1.1417. For now, as long as the bulls hold the 55-day SMA (currently at 1.2346) to guard against rebounds, the downside risk will persist. In terms of trading strategy, going short at highs is recommended.
Trading Recommendations
Trading Direction: Short
Entry Price: 1.2210
Target Price: 1.2000
Stop Loss: 1.2346
Valid Until: 2023-11-13 23:55:00
Support: 1.2070, 1.2038, 1.2012
Resistance: 1.2159, 1.2224, 1.2315


