
Chapter 76 11/08 WTI: After Breaking the "Head and Shoulders Top" Pattern, the Market Could Test the Bottom of
Abstract: WTI crude oil fell below US$80.00 a barrel for the first time in over two months. New doubts about whether the Fed will complete the tightening policy overshadowed the production cuts in Saudi Arabia and Russia, and the risk premium subsided.
Fundamentals
The settlement price of international crude oil fell sharply by about 4% on Tuesday. WTI crude oil closed down US$3.45, or 4.27%, to $77.37 a barrel; Brent crude oil futures closed down US$3.57, or 4.19%, at US$81.61 a barrel.
Fed officials said it was too early to declare victory over inflation, and the financial market as a whole fell and the USD strengthened.
The decline occurred after OPEC+ cut production to support the market. Last weekend, the two countries indicated that they would continue to implement restrictions until the end of the year. However, these measures and the conflict between Palestine and Israel are not enough to stop the price drop caused by global consumption concerns in the past few weeks.
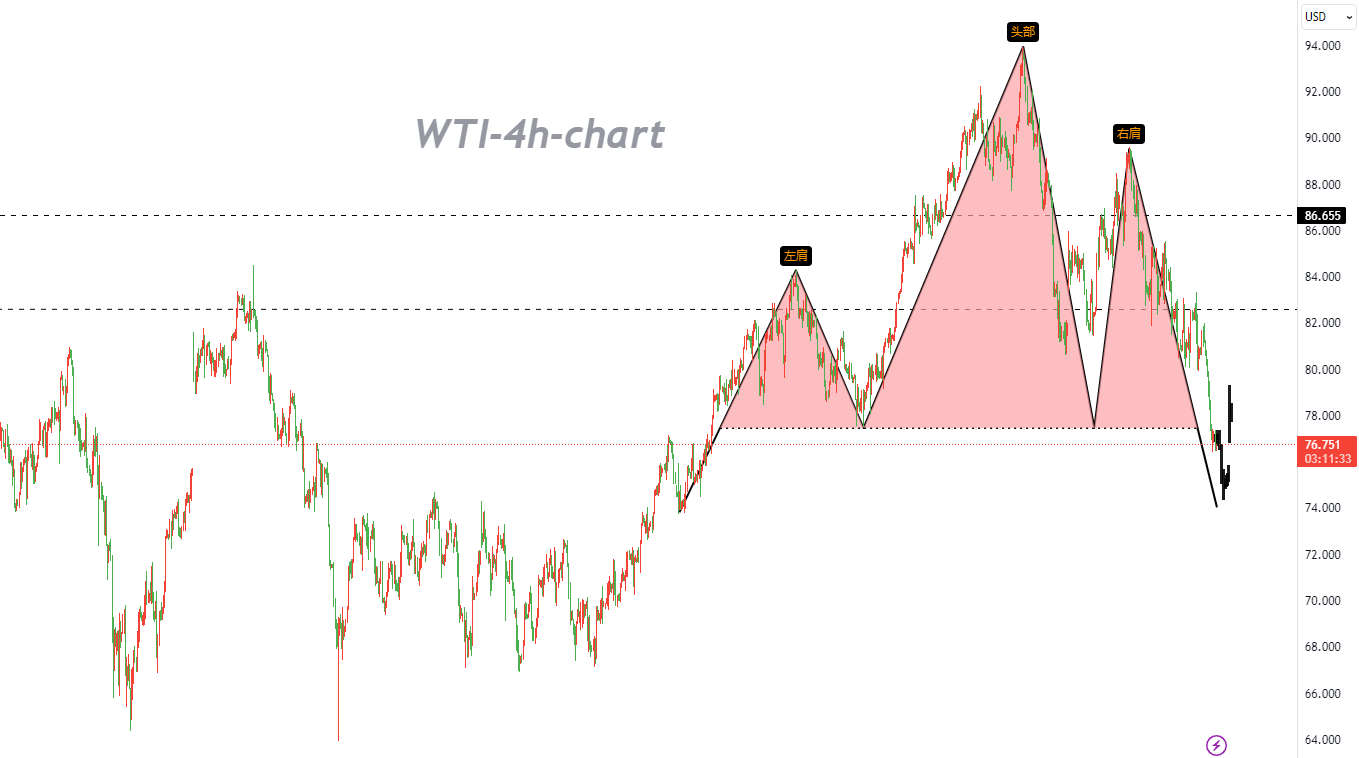
At the same time, at this stage, oil prices are facing the contradiction between low inventory and weak supply and demand. The macro level is also facing a complicated situation. At present, WTI crude oil has fallen below the critical neckline position of US$77.49 per barrel; According to our pattern, the price is expected to fall further. At the same time, the sharp drop in international oil prices is more conducive to the U.S. Department of Energy to replenish its strategic reserves, which means that investors' pessimistic expectations of the crude oil market outlook will dominate the fluctuation of oil prices in the future.
Under the background that the fundamentals have not changed much and the Palestinian-Israeli conflict is no longer expanding, it is expected that the macro level will dominate the market expectations in the later period. In addition, the dispute over the market share of the supply side may be an important factor affecting the oil market next year, so we need to pay attention to the convening of the OPEC+ ministerial meeting on November 26.
Currently, oil prices have fallen below the key neckline position and are expected to fluctuate within a wider range. In the short term, it is expected that it will still fluctuate in the range under the background of low inventory, but with the slowdown of destocking and the slow weakening of U.S. diesel export strength, the oil price will be strong or difficult to maintain for a long time in the later period.
In addition, the U.S. Energy Information Administration (EIA) inventory data released later today may also bring fluctuations to this commodity. A large increase in inventory may indicate a weak demand level, which may lead to a decline in crude oil prices. On the other hand, the published data is flat, indicating that consumption is still high or supply is limited, which may bring benefits to the commodity.
Technical Analysis
WTI crude oil fell sharply yesterday and fell below the neckline in the pattern of "head and shoulders top" within the 1D timeframe, confirming that the equivalent (up/down) range with the rising point of the left shoulder represented by US$73.74 is coming soon. Therefore, the resulting decline may last for US$3, and the price of crude oil may fall to US$73.74 next.
However, technical indicators show that WTI crude oil prices will rise. 100 SMA higher than 200 SMA indicates that the path of least resistance is upward, but the price of crude oil has fallen below 200 SMA, which is an early indicator of bearish pressure.
At the same time, stochastics suggest that bears are oversold or exhausted; therefore, a move higher would signal a return of bullish momentum.
Nonetheless, the Relative Strength Index has more room to fall before it reaches the oversold zone; therefore, the price may follow. It is recommended to go short at the highs.
Trading Recommendations
Trading direction: Short
Entry price: 77.39
Target price: 73.74
Stop loss: 81.50
Deadline: 2023-11-22 23:55:00
Support: 76.32, 74.48, 73.74
Resistance: 77.49, 78.23, 79.18


