
Chapter 92 11/16 WTI: Market Entangled in Another Round of Left-Right Shoulder Game, Price Surpassing the Latte
Summary: Risk appetite may determine the next move in commodity prices, but it's worth noting that the latest US Consumer Price Index (CPI) data suggests a lower likelihood of further Fed tightening. However, the Producer Price Index (PPI) data presents a mixed picture, indicating some evidence of potential strengthening in underlying inflation.
Fundamentals
In the week ending November 8, EIA crude oil inventories increased by 3.6 million barrels, surpassing the expected 2.5 million barrels. The higher-than-expected inventories indicate soft demand for fuel and energy commodities. Nevertheless, this is still lower than the previous increase of 13.9 million barrels.
Following the government report showing an expansion in US crude oil inventories and hints from Fed officials about the possibility of maintaining high interest rates, oil prices fell for the first time in the past five trading days.
In recent weeks, crude oil futures have been struggling to find direction, but data from the US Energy Information Administration (EIA) on Wednesday confirmed that US crude oil inventories have been expanding and are currently at their highest level since August. Meanwhile, comments from the Fed's Mary Daly extinguished hopes of a slowdown in rate hikes. The surge in the yield of the 10-year Treasury bond implies that interest rates will remain high, potentially slowing down the economy and damaging consumer spending. WTI fell 2% on Wednesday, closing below $77 per barrel.
Despite a significant increase in US crude oil inventories, the decrease in US refined product inventories indicates strong demand for gasoline, diesel, and aviation fuel. This suggests that refineries will eventually purchase more crude oil to produce refined products, and demand for crude oil may ultimately rise.
Currently, the crude oil market has been weighing different perspectives on supply and demand. The International Energy Agency (IEA) stated on Tuesday that the global crude oil market for this quarter will not be as tight as expected, with production growth in the US and Brazil exceeding expectations. Previously, OPEC made a more optimistic assessment, emphasizing a robust growth trend and healthy fundamentals.
After eliminating all risk premiums associated with the conflict between Israel and Hamas, oil prices fell to a three-month low last week. Weak US inflation data on Tuesday sparked bets on the Fed starting to cut interest rates in mid-2024, which could improve the long-term outlook. However, concerns about supply increases and weak consumption persist, making it difficult for prices to find direction. The US PPI saw its largest drop since April 2020.
Currently, signs of market softness continue to appear along the futures curve. WTI crude oil's near-month spread turned into a premium for the second time in a week, meaning that the near-term prices are lower than the forward prices. Earlier today, the second-month contract also exhibited a similar situation, suggesting a resolution of concerns about supply scarcity.
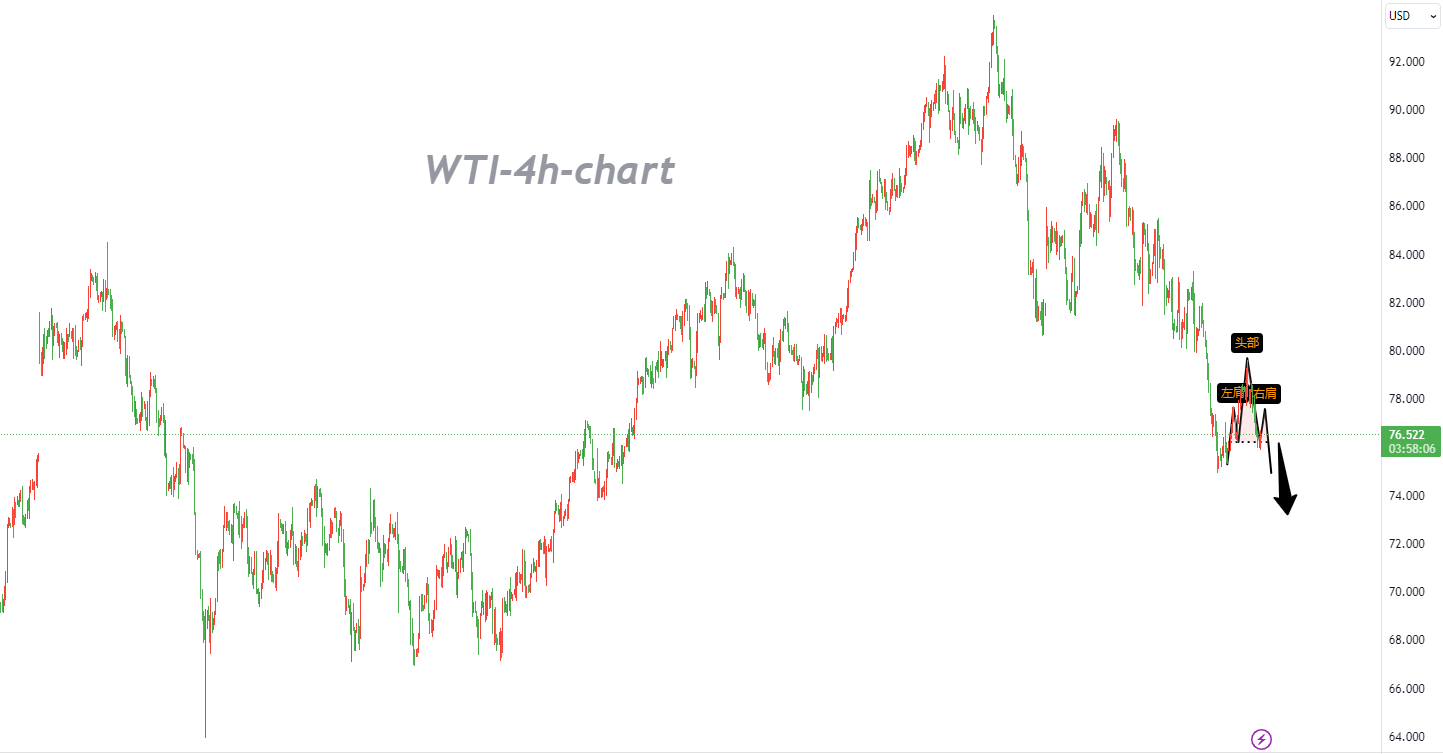
Technical Analysis
As WTI crude oil prices approach the support level around $75.43, the price structure may be forming a descending triangle pattern in the short term. If the bottom holds, WTI crude oil prices could rebound to around $77.60, forming the right shoulder of the descending trend.
This aligns with the 200 SMA dynamic inflection point, adding strength to its role as resistance. The fact that the 100 SMA is below the 200 SMA indicates that the path of least resistance is downward, and it is more likely for the upper limit to hold rather than be breached.
However, the gap between indicators is narrowing, suggesting diminishing bearish pressure and the potential for a short-term bullish crossover. Nevertheless, with prices still below the 10 and 20 SMAs, the bearish sentiment remains prevalent.
The stochastic oscillator has entered oversold territory, indicating that bears are exhausted. Therefore, an upward movement would signify a return of bullish momentum. With room for the oscillator to rise significantly before reaching overbought conditions, crude oil prices may continue to follow suit.
The RSI is also in oversold territory, suggesting that bears may relinquish control in the short term, allowing buyers to take charge. Despite this, a breakdown below the bottom of the triangle could trigger a decline of a magnitude equal to the pattern's height. In terms of trading strategy, prioritizing going short at highs is recommended.
Trading Recommendations
Trading Direction: Short
Entry Price: 77.60
Target Price: 72.29
Stop Loss: 78.80
Valid Until: 2023-11-30 23:55:00
Support: 75.35, 74.92, 73.76
Resistance: 77.74, 78.71, 79.68


