
Chapter 9 09/26 XAUUSD: Gold Prices Remain Volatile Until the End of the Month with No Direction
Abstract: The Fed's "long-term upside" interest rate stance pushes the USD and U.S. Treasury Securities yields higher, which puts heavy downward pressure on gold prices; nonetheless, gold prices are still looking for potential support.
Fundamentals
On Tuesday, the expectation that the Federal Reserve will raise interest rates again before the end of the year, and may maintain high interest rates for a period of time until inflation returns to the target of 2%, triggered the continuous rise of the USD; It also pushed the yield of 10-year U.S. Treasury Securities to exceed 4.5%, a record high in 16 years. This puts pressure on unprofitable gold.
The Fed stated last week that it would keep interest rates high as long as necessary. In addition, Minneapolis Fed President Kashkari said he expected to raise interest rates again.
In addition, the fear related to the possible closure of the U.S. government on October 1, the severe warning issued by Moody's, and the rising risk aversion that endangered the U.S.'s AAA rating ... made gold "lose its luster".
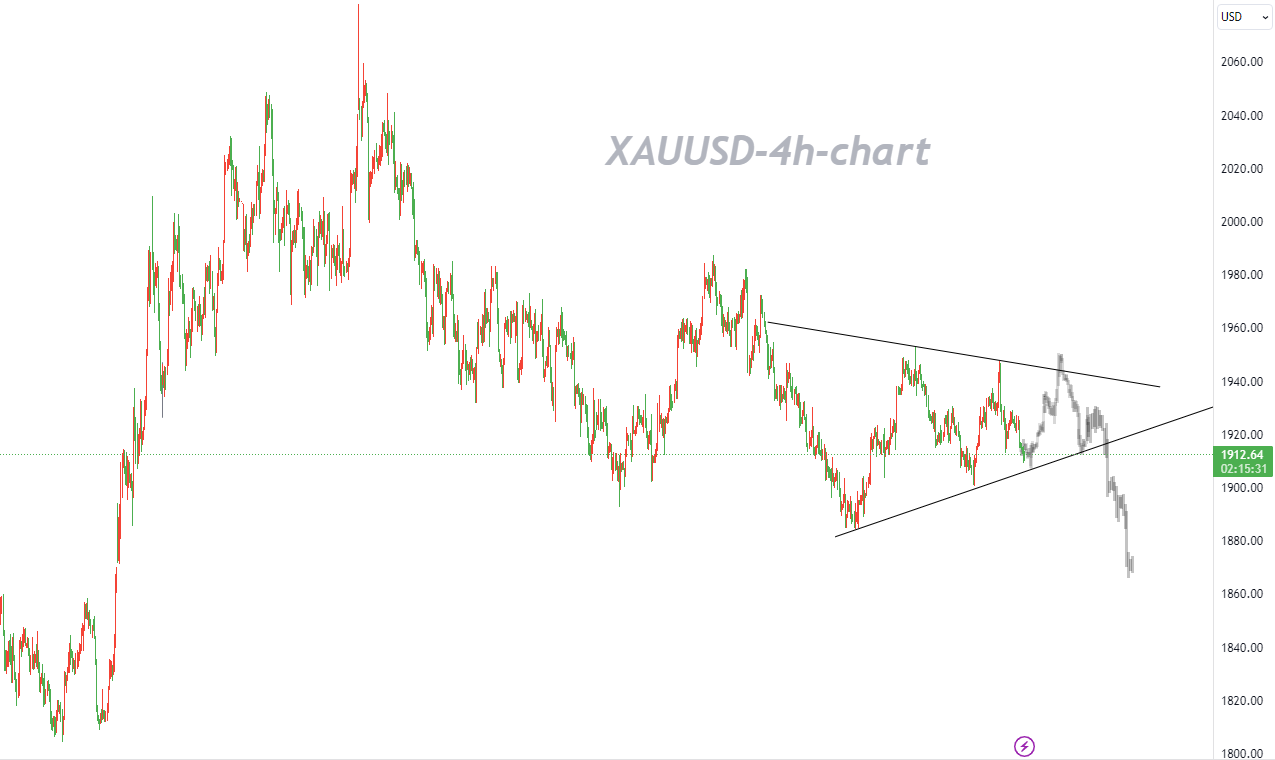
Therefore, the price of gold has continued its downward trend since the spring. Among them, bulls and bears actively interacted at the level of US$1,947. In July, this level played a supporting role, but it deteriorated in August. The sharp drop on September 20 confirmed the dominance of bears, but it was more like an intraday mood fluctuation and could not reflect the intrinsic value of gold.
So far, the price is located near the bottom of the triangle fluctuation range, and the supply and demand are not balanced; Therefore, this increases the possibility of a sharp rise in volatility. Although we are bearish on the gold price in the medium term, if the lower edge of the triangle can hold the short position and continue to fall, then the gold price will still have the last chance to rise before it officially falls below the triangle consolidation.
Technical Analysis
On Monday, after being rejected near the very important 200-day SMA, gold bulls fell to a 10-day low of US$1,910 on Tuesday, and entered a downward trend. However, the technical situation in the 1D timeframe is still unclear because the SMA is completely bearish. Therefore, the subsequent weakness seems likely to retest the monthly low of US$1,900. More subsequent selling will be seen as a new trigger for bearish trading and pave the way for further depreciation in the near future.
However, the current price is testing the lower edge of the fluctuation triangle, the Relative Strength Index is also touching the demarcation line between the positive and negative areas, and the stochastic indicator is showing oversold, among other things, which could trigger another reversal to test the upper edge of the fluctuation triangle, which is also the area of the fierce competition between the bulls and the bears at the US$1,947 level that we described earlier.
Overall, although the short-term momentum is bearish, we still believe that the strong demand area in the range of US$1,900-1,910 can stop this decline and maintain the fluctuating tone until the end of the month. It is recommended to buy the dips.
Trading Recommendations
Trading direction: Long
Entry price: 1906
Target price: 1948
Stop loss: 1884
Deadline: 2023-10-10 23:55:00
Support: 1910, 1904, 1900, 1889
Resistance: 1918, 1922, 1929, 1936


