
Chapter 11 09/26 USDCAD: Mixed Momentum Indicators Complicate the Outlook
Abstract: During trading hours on Tuesday, the USDCAD fluctuated higher. The weakness of the CAD is affected by the fall in oil prices, while the long-term momentum accumulation of the U.S. has fully boosted the USD and provided upward support for the USDCAD.
Fundamentals
On Tuesday, in addition to the overall strength of the USD, weak risk appetite and lower crude oil prices posed resistance to CAD assets.
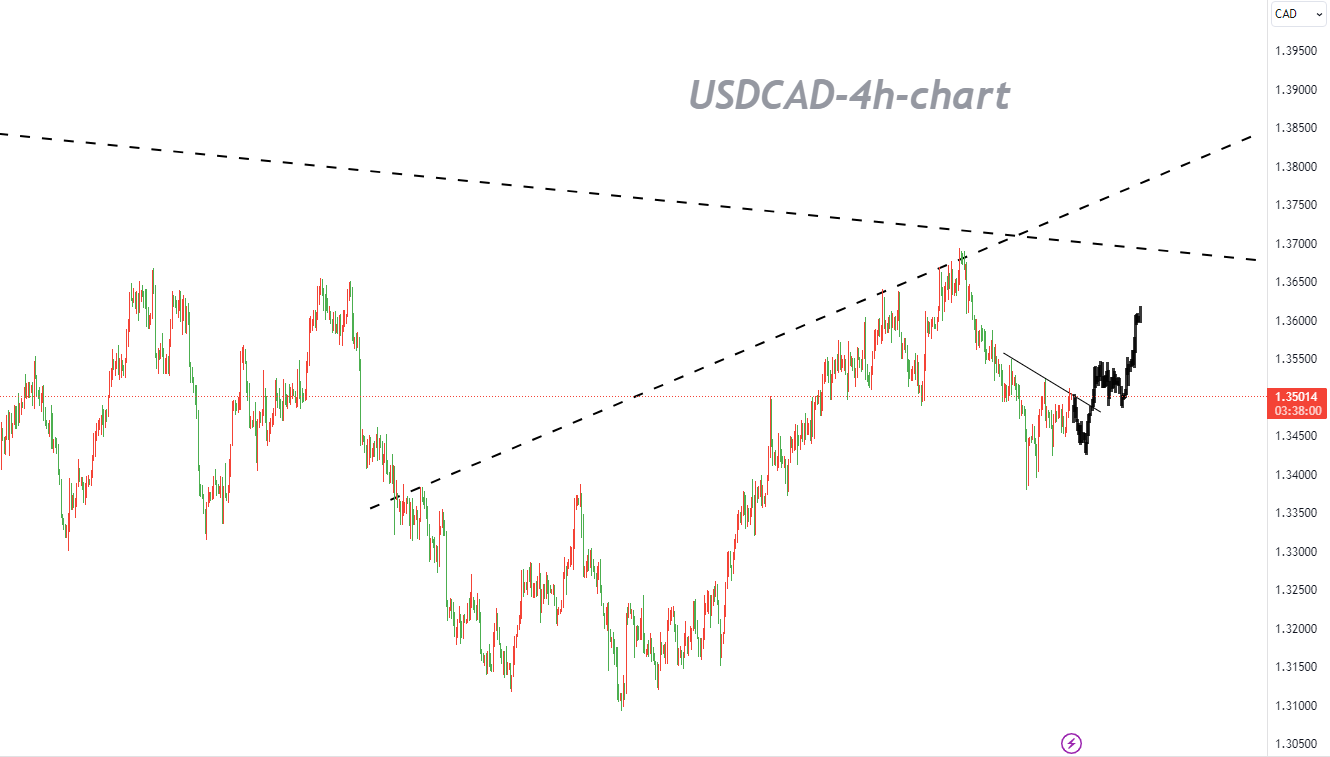
The USDCAD continued to consolidate in a flag pattern between the support level of 1.3425 and the resistance level of 1.3510. The CAD has lost some technical initiative that seems to be developing in such a timeframe because the range trading is weakening the downward trend of the USD in the past few trading days. Nevertheless, the Relative Strength Index is located in the range of 40-60, indicating that the USD assets still show a non-directional trend, but based on the long-term momentum accumulation of the U.S. and the strength of the USD, it still constitutes upward support for the USDCAD.
Investors are waiting for the data of Canada's GDP and the data of the U.S.'s core personal consumption expenditure (PCE) price index released on Friday to seek new impetus.
Technical Analysis
After the upward rebound of the USDCAD started on July 14, it temporarily stopped the upward trend by falling below the previous low of 1.3488.
The USDCAD's downtrend since the test of the 5-month peak on September 7, 2023 has been impressive, but the structure of the move seems to be more tricky at this stage, especially as the bulls face a lack of momentum when they decide to react more strongly. The convergence of the SMA may open the door to significant volatility, but it also elevates the significance of the 1.3439-1.3549 range.
In this price action, momentum indicators are currently in a contradictory situation. On the one hand, both the Relative Strength Index (RSI) and the Average Directional Index (ADX) confirm the current bearish trend of the USDCAD and, therefore, may support the short-term bears' intentions. On the other hand, the Stochastic Oscillator is once again undermining the bears' appetite. It is trying to break above the oversold range and the SMAs. If it succeeds, it will send a strong bullish signal.
If bulls try to take advantage of possible bullish signals, they will try to keep the USDCAD above the busy range of 1.3439-1.3460, which consists of 50-day and 200-day SMAs. They may try to break through the low of 1.3504 on October 4, 2022, and then they may look to the rising trend of 23.6% Fibonacci retracement of 1.3605 from April 5 to October 13, 2022.
On the other hand, bears could be confident and ready to break the 1.3439-1.3460 support range. They could then aim for the busy 1.3375-1.3397 range, which consists of the 38.2% Fibonacci retracement and the 100-day SMA as well as the July 14, 2023 upward trendline. Then, they may consider pushing the USDCAD even lower until the key 1.3190-1.3222 range.
Overall, the USDCAD bears may be ready for another pullback. However, mixed momentum indicators complicate the outlook. We are more inclined to see a structural pattern of a pullback followed by a continuation of the rally. It is recommended to buy the dips.
Trading Recommendations
Trading direction: Long
Entry price: 1.3445
Target price: 1.3633
Stop loss: 1.3370
Deadline: 2023-10-10 23:55:00
Support: 1.3465, 1.3425, 1.3378
Resistance: 1.3524, 1.3551, 1.3587


