
Chapter 34 10/17GBPJPY: It Looks Likely to Keep Pulling Back as "Head and Shoulders Top" Pattern Takes Shape
Abstract: With the formation of the "Head and Shoulders Top" pattern, the GBPJPY showed an overall downward trend.
Fundamentals
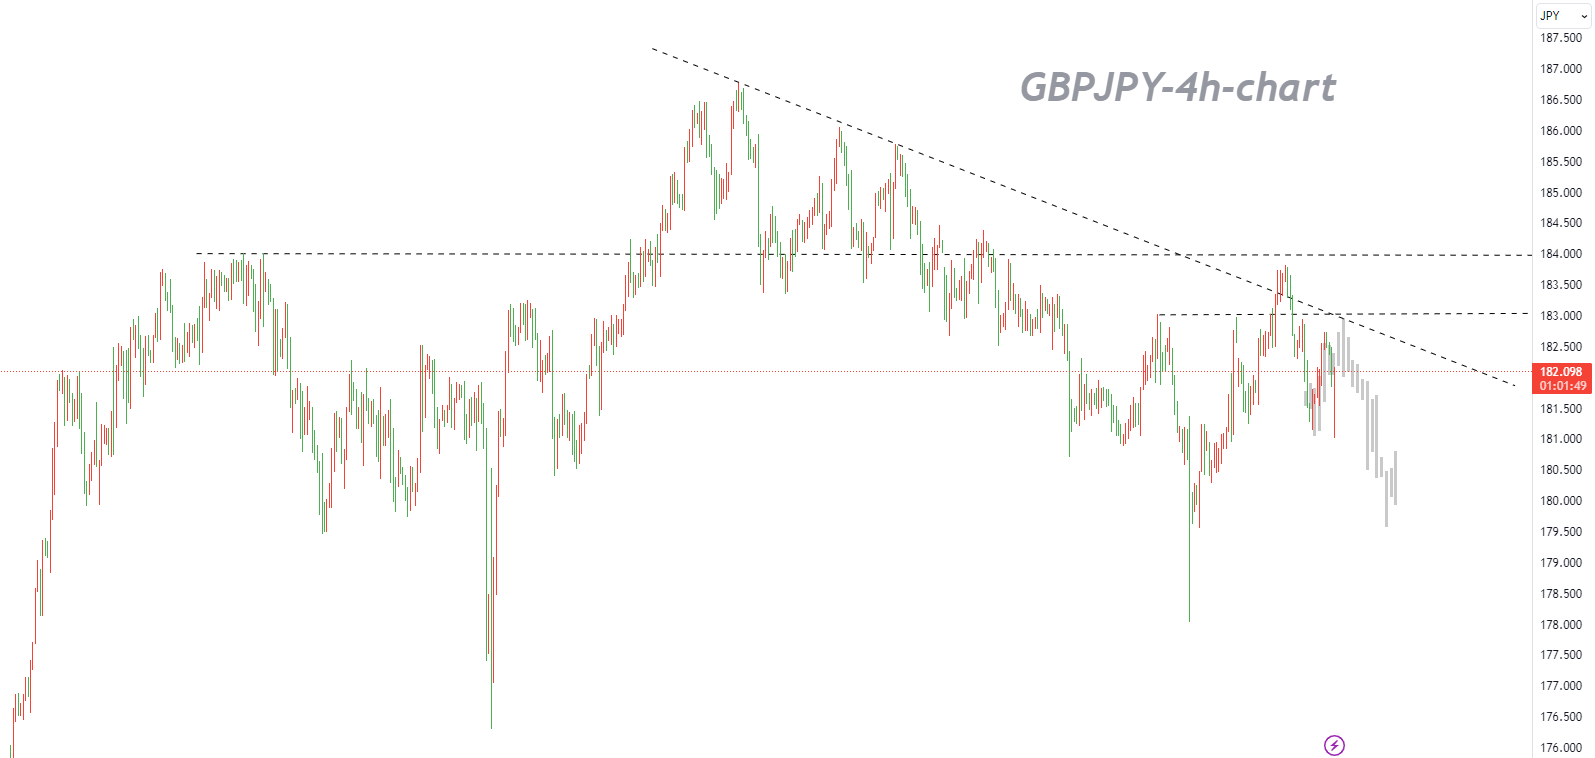
The " Head and Shoulders Top" pattern of the GBPJPY consists of a high of 184.01 on July 5, a high of 186.78 on August 22, and a high of 183.83 on October 12 respectively. At present, the downtrend will test the first support level of 181.15.
The first support level at 181.15 is considered important for several reasons. It acts as overlapping support and aligns with the 61.80% Fibonacci retracement, suggesting a strong technical confluence that could make it a potential price support area.
In addition, the intermediate support level is 182.24. This level is very important because it serves as a pullback support level and coincides with the 38.20% Fibonacci retracement, which enhances its importance as a potential support level.
In terms of resistance, due to various factors, the first resistance level of 182.82 is considered to be very important. It represents a high fluctuation resistance level and is consistent with the 61.80% Fibonacci retracement, which may become an obstacle to further price increases.
Additionally, the second resistance level is at 183.81, which is very important as it is swing high resistance and indicates a potential challenge for further price gains.
Technical Analysis
The GBPJPY has been falling steadily since the peak of 186.78 in 2015, hitting a low of 178.00 at the beginning of this month, and then rising above the level of 183.00, forming a "Head and Shoulders Top" pattern consisting of a high of 184.01 on July 5, a high of 186.78 on August 22, and a high of 183.83 on October 12 respectively.
The current technical indicators make people doubt whether the GBPJPY will find enough buying to go higher again.
The momentum index shows that the Relative Strength Index has not made much progress around 50, and the Stochastic Oscillator is still declining. There is little hope for MACD to rebound. Although the energy is still diverging upward below the 0-axis, it is losing momentum.
At the same time, in the trend signal, the 20-day and 50-day SMAs form a bearish cross, which casts a shadow over the short-term prospects.
The basic situation is that the bears stay on the sidelines until the price closes below the support range of 179.00-180.00, which is where the Fibonacci retracement of the previous upward trend and the two key limit lines are located. If this bearish situation occurs, the price may seek support between the 38.2% Fibonacci level at 175.85 and the previous obstacle of 174.50 in June. The 200-day SMA and 50% Fibonacci could next buffer the downward strength around 172.50. Falling below this level will offset the medium-term bullish outlook, which could lead to a straight drop to the 61.8% Fibonacci level at 169.13.
Otherwise, the bulls may once again fight against the nearby resistance trend line and the 50-day SMA of 183.20. If it wins, the index may rise exponentially and reach an eight-year high of 186.45 or slightly higher than 187.75. The driving force that may create new buying is the lasting extension above the rising line of 189.60 in October 2022.
Overall, the GBPJPY is currently neutral, trading below the resistance trend line at 183.20 and above the key support range of 179.00-180.00. A price tilt to either side could trigger strong buying or selling. It is recommended to go short at the highs, as the right shoulder in the pattern of "Head and Shoulders Top" is lower than the left shoulder
Trading Recommendations
Trading direction:Short
Entry price: 183.30
Target price: 179.45
Stop loss: 184.50
Deadline: 2023-10-31 23:55:00
Support: 181.05, 180.30, 179.47
Resistance: 182.71, 183.02, 183.81


