
Chapter 46 10/23 XAUUSD: Three Forces Drive Gold Price into Overbought Territory, Expecting a Subsequent Retrea
Summary: Technical breakthroughs, a return to fair value, and geopolitical tensions have propelled gold to a five-month high. Overbought signals on the momentum indicator suggest that the rapid upward trend has become overstretched, with an expectation of a subsequent price retreat.
Fundamentals
Over the past three weeks, gold prices have risen from a key support level of $1,810 to an intraday high of $1,997 last Friday, marking an overall increase of $187, or 10.3%.
One of the primary drivers of the bullish momentum has been gold's break above two key technical milestones. One is the upper limit of the medium-term descending channel, which had restricted the previous rebound since May 4, 2023. The second variable is the critical 200-day SMA. These breakthroughs in key resistance levels triggered a highly positive feedback loop in the market, sparking short-covering at the end of September, as large speculative net long positions in the gold futures market dropped to 161,861 contracts over the past few weeks. According to the Commitment of Traders (COT) report, this is the lowest point so far this year.
Additionally, a return to fair value has been a crucial factor causing heightened sensitivity in gold prices.
The driving force behind the heightened sensitivity in gold prices is the increased geopolitical risk premium due to the long-standing conflict between Israel and Hamas, as well as the potential for rising crude oil prices, which could trigger stagflation risks. This is because an increase in oil prices may have spillover effects on a broader Middle East region, potentially leading to disruptions in the oil supply in that area, among other factors.
Interestingly, the exacerbation of stagflation risks over the past three weeks has overshadowed the rising opportunity cost of holding gold. The yield on the 10-year US Treasury note has simultaneously risen and reached an intraday high of 5% last Thursday, October 19th. This is the highest level since before the financial crisis of July 2007.
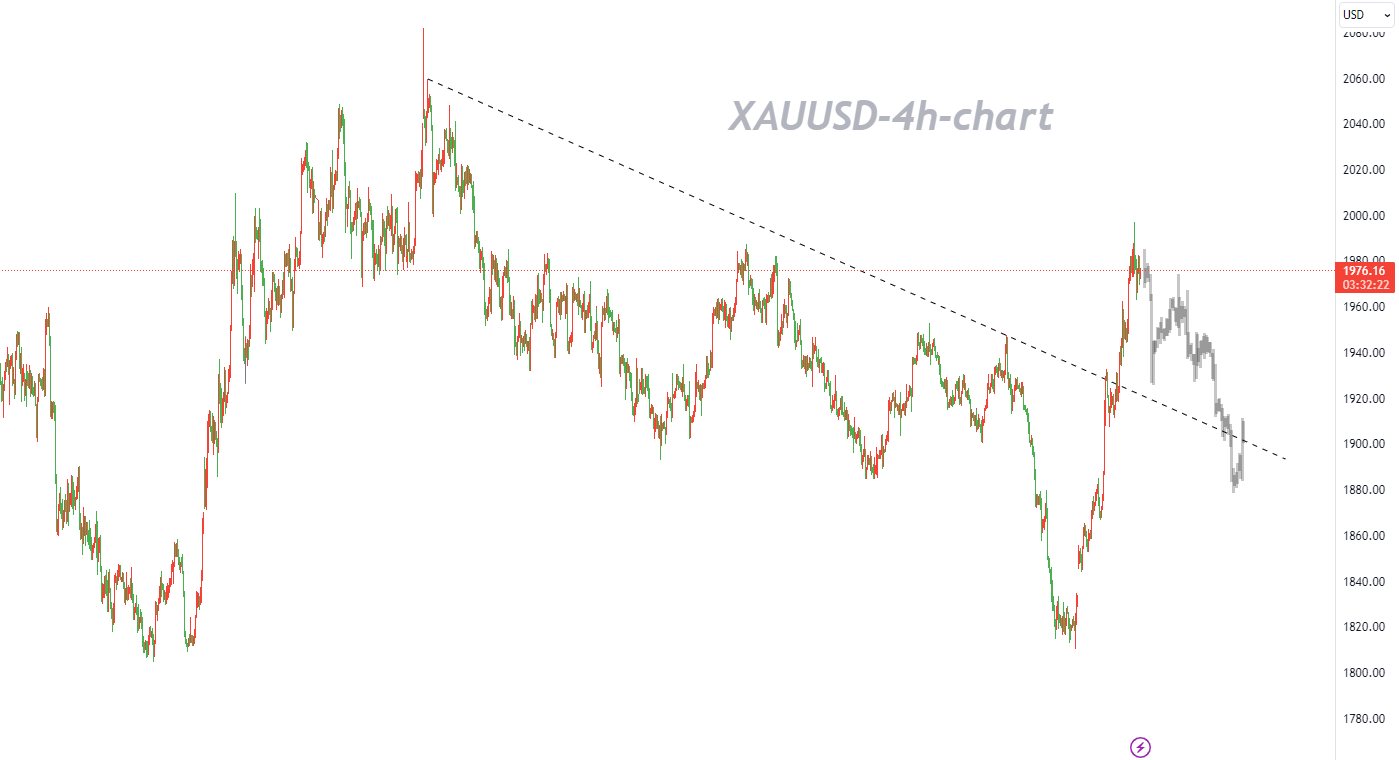
From a structural perspective, the sharp upward trend in gold prices since the low of $1,810 on October 6, 2023, reached an overextended state after hitting a five-month high last Friday. This is further emphasized by the Relative Strength Index (RSI) being in an extremely overbought bearish divergence condition.
These observations indicate that the short-term bullish momentum in gold prices has weakened during the highly upward-trending phase. The next potential trend could be a corrective retracement, with a short-term target around the daily average and the resistance level near $1,900, in the vicinity of the previous medium-term descending channel. A new potential upward impulse sequence will also unfold in the range of $1,870 when the price reaches the second retracement point, but it is not expected to surpass the previous high of $1,997.
On the other hand, if our assessment is incorrect and the gold bulls regain control, breaking the $2,006 mark would negate the current bearish tone, with the next upward resistance in the range of $2,028 to $2,037.
Technical Analysis
Gold has been on a sharp upward trend since testing $1,810 in early October. However, due to reaching overbought levels, gold is currently undergoing a minor retracement.
If buying pressure persists, the peak in July at $1,987 may initially restrain the upward movement of gold. Breaking through this level, the bulls may target the range between $1,997 and $2,006, which is defined by the recent five-month high and a key psychological level. A breakthrough of this range could lead to the resistance zone in April between $2,028 and $2,037.
On the other hand, bearish action could result in a continued decline in prices, with a short-term target around the February high of $1,959. If this support level is breached, gold may challenge $1,932, overlapping with the 200-day SMA. Should that barricade also fail, the focus may shift to the support level/psychological level of $1,900 from September, which has been a strong support level maintaining price strength since June.
Overall, the long upper shadow left by gold after testing a five-month high last Friday suggests that the bulls seem to be facing ongoing upward pressure, pushing gold into overbought territory. In terms of trading strategy, the focus is on going short at highs.
Trading Recommendations
Trading Direction: Short
Entry Price: 1987
Target Price: 1923
Stop Loss: 2012
Valid Until: 2023-11-02 23:55:00
Support: 1959, 1945, 1934, 1925
Resistance: 1987, 1997, 2000, 2006


