
Chapter 22 Oil Prices Pull Back Again to Seek Support at the Bottom(11.16)
Fundamentals
WTI crude oil oscillated downward during the Asian session on Thursday, Nov. 16, and it is currently trading near $76.0 per barrel. Yesterday, oil prices pulled back again partially on a stronger dollar and the risk of a U.S. government shutdown if the stopgap spending bill cannot be passed before Nov. 17. Another factor was the more-than-expected crude inventories released by the EIA. The biggest reason, however, was the Iraqi oil minister's words that Iraq and Turkey reached an agreement on the resumption of oil exports in the north, which allows oil companies to resume production in oil fields in the Kurdistan region within three days, adding an extra 400,000 barrels of crude supplies a day. Yesterday, oil prices retraced to 77.4 before rebounding to 78.2, and then they moved downward, falling as low as the 76.5 level. We entered the market at 77.5 and also exited almost at the same level as the rebound was too weak. It was all in vain, but this is part of the trade. Sometimes, we may watch the market for a whole day but just trade for few minutes. We have to get used to and enjoy this. After yesterday's pullback, oil prices in the short term will continue to find support at the bottom. The overall trend is weak, but it will fluctuate rather than just decline. The current weakness of oil prices once again put pressure on OPEC+ as all of its efforts made this year is about to be in vain. Before the next meeting, the market will not bet on the output cut resolution. Looking at the inventory report announced yesterday, crude oil inventories increased but there was also oil de-stocking as the U.S. strategic oil reserves continued to decline. The overall data is neutral. Given the 1.2 million barrels of strategic oil reserves will be bought at the price of $77.57 as announced on Monday, the current price of oil is again cost-effective. The downside momentum has been limited in the short term. Aggressive traders can continue to find opportunities to buy low as the probability of oil prices rising before the end of the year is much greater than that of falling.
Inventories: U.S. EIA crude oil inventories increased by 3.6 million barrels for the week of Nov. 10, compared with the expected increase of 1.793 million barrels. Cushing, Oklahoma crude stocks increased by 1.9 million barrels. Refined oil stocks decreased by 1.4 million barrels, compared with the expected decrease of 1.242 million barrels. Gasoline stocks declined by 1.5 million barrels, compared with the expected increase of 622,000 barrels. U.S. commercial crude oil imports excluding strategic reserves were 6.373 million barrels per day (bpd) in the week of Nov. 10, a decrease of 21,000 bpd from the previous week.
Data: U.S. PPI rose 1.3% in October from a year earlier, much lower than the expected 1.9% and the previous 2.2%; it was down 0.5% from a month earlier, the deepest decline in three-and-a-half years, much weaker than the expected rise of 0.1% and the previous increase of 0.5%. U.S. retail sales fell 0.1% in October from a month earlier, the first decline since March this year, but the decline was smaller than the expected 0.3%, and the previous data was revised from an increase of 0.7% to an increase of 0.9%. Core retail sales increased by 0.1% MoM, which was expected to be flat, and the previous data was an increase of 0.6%.
Today, investors need to focus on the U.S. initial jobless claims, the Philadelphia manufacturing index for November and Fed officials' speeches.
Technical Analysis
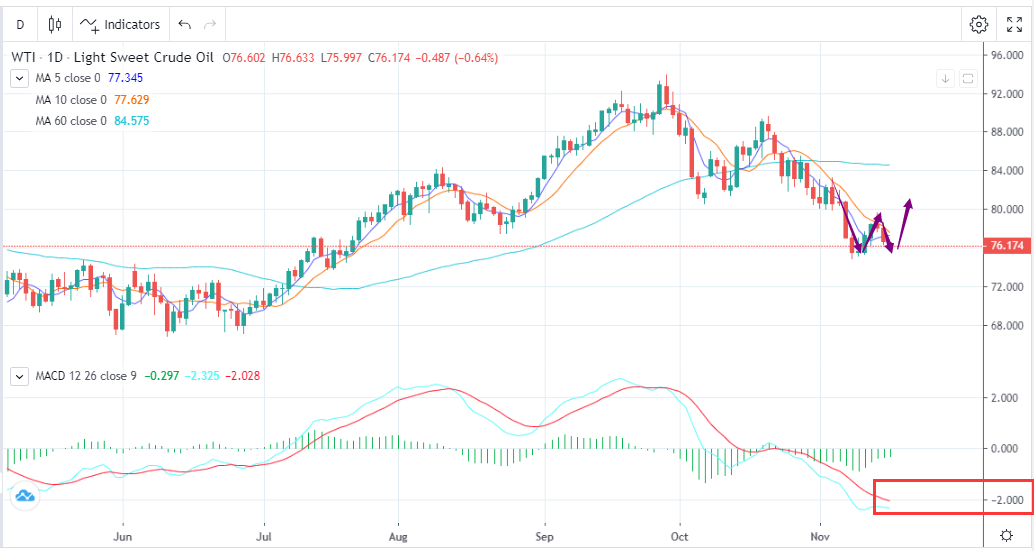
Yesterday, oil prices pulled back after rebounding, and then closed slightly lower with a long upper shadow. Technically, the 1H MACD bearish momentum has been fully released, and oil prices are close to the lower Bollinger band in the 4H time frame. Today, the Asian session will see rebounds in the hourly time frame, but the daily pattern remains weak after 3 consecutive days of decline, forming an evening star pattern. If the lower Bollinger band in the 4H time frame cannot support the price, the price will continue to make new lows. But the daily MACD indicator has been oversold, so the downside space is also limited. There is very strong support around the previous low of 75. A local double-bottom pattern is expected to show.
Trading Recommendations
Trading direction: Long
Entry price: 75.000
Target price: 78.000
Stop loss: 74.500
Support: 74.900, 73.800
Resistance: 78.500, 80.000


