
Chapter 23 Gold Strengthens Sharply As Dollar Keeps Descending(11.17)
Fundamentals
During Friday's (November 17th) Asian session, spot gold oscillated narrowly, and it is now trading at 1982. Yesterday, the U.S. Congress passed a stopgap funding bill and avoided a government shutdown. The U.S. data were below expectations, showing signs of economic weakness, once again weighing on the dollar and boosting gold prices. Yesterday, the gold price first rose from 1956 to a high of 1970 and then pulled back to 1960. It surged again in the U.S. session, closing with a large bull candle. Recent U.S. economic data have been weaker than expected, so there are stronger expectations of the Fed stopping raising interest rates. In the short term, gold prices are expected to be stronger driven by sentiment. However, the dollar will not fall smoothly unless the U.S. Treasury yields turn downward, which is less possible for now. With the supply-demand structure deteriorating, perhaps the Fed will keep interest rates higher for longer than we expected, so the correction in gold prices is not yet over. But in the long run, we can still buy gold at lows.
Data: U.S. Initial Jobless Claims reached 231,000 last week, a new high since the week of August 19th, and it was expected to be 220,000 compared to a revised previous number of 218,000. As of the week of November 4th, U.S. continuing jobless claims were 1.865 million, rising to the highest level in nearly two years, while the expected number was 1.847 million. U.S. industrial production fell 0.6% MoM in October, compared with an expected 0.3% drop and a 0.1% rise in the previous reading. Manufacturing output fell 0.7% MoM, compared with an expected 0.3% drop and a 0.2% rise in the previous reading. In addition, the U.S. NAHB housing market index in November was 34, a decline for the fourth consecutive month, refreshing a record low since December 2022.
News: Federal Reserve Bank of Cleveland President Mester said that while inflation has cooled, it will take time to fully fall back to the Fed's target level of 2%. If the economy develops differently than expected, monetary policy needs to remain flexible and respond appropriately to changing prospects and risks.
Today's focus: No heavy data, and the market should consume the stock.
Technical Analysis
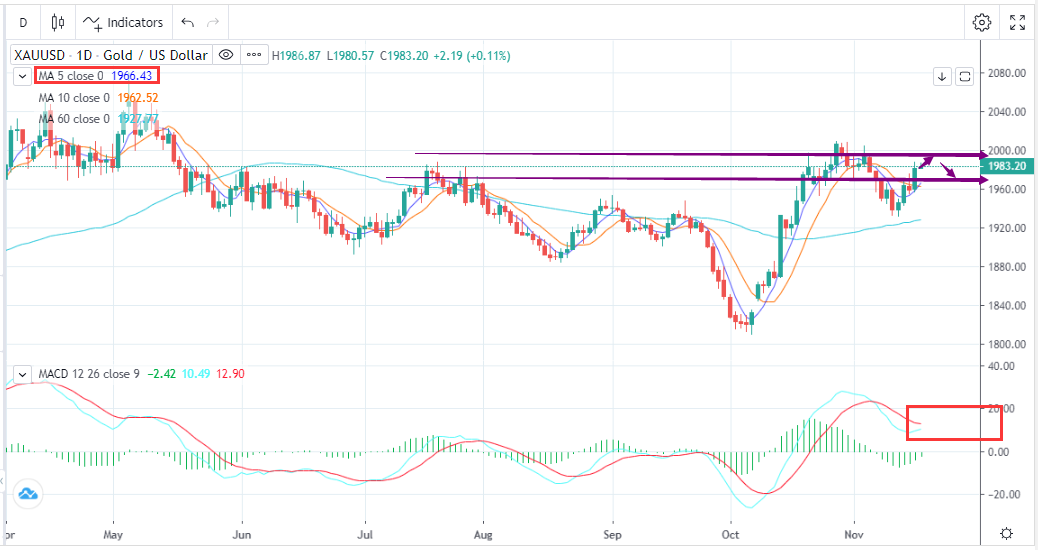
There wasn't great space for gold in the Asian session yesterday. It once retraced to 1956 and then surged to 1965 with oscillations, failing to test the area from 1950 to 1953. Thus, there was no space to go long. Nevertheless, gold pulled up quickly with the support of a weakening dollar in the European and the U.S. sessions, crossing above the weekly high (1975) to reach 1980. At the same time, it once touched 1988, tending to test the double shoulder between 1933 to 1997 and closing the daily chart with a big-bullish-candle. By extending this week's rebound, the 5-day SMA starts to cross above the 10-day SMA, activating the ascending trend. Furthermore, we clarified last week that when gold retraced enough shortly, there would not be space below. Now, gold tests the previous high again. However, the momentum is insufficient, and the MACD is at a high level. Thus, gold will maintain oscillating for a while and could be stopped in front of the previous high to form a double top structure. According to the 1H chart, MACD is in the overbought area, and there are retracements. But, since it is just a retracement, we should look at the support below near the 60-day SMA (1968). Today, the trading range will start from 1968 to 1995, and aggressive traders should buy low and sell high in this range.
Trading Recommendations
Trading direction: Short
Entry price: 1997
Target price: 1968
Stop loss: 2002
Support: 1968.000/1950.000
Resistance: 1993.000/2008.000


