
Chapter 27 The Market Is Thin During Thanksgiving (11.24)
Fundamentals
During Friday's (November 24th) Asian session, spot gold oscillated narrowly, and it is now trading at 1993. Yesterday was Thanksgiving Day and the U.S. session was closed, and the market trade was thin for this period. For example, the USDX dropped slightly, and the gold appreciated a little with limited trading space despite a range of 10 dollars. Yesterday, the Eurozone PMI data slightly warmed up, but is still below the threshold for 6 consecutive months. Besides, the risk of recession also increases, and yesterday's minutes of the European Central Bank (ECB)'s monetary policy meeting in October showed partial dovish. Thus, in the middle of next year, the ECB may start the rate cut earlier than the U.S., which also signals that the external financial environment is gradually open. It will be a greater opportunity for future gold prices. For the USDX, although the long-term weakening trend is taking shape, the descending pattern will be complex after the oversold rebound demand and the constraints of U.S. bond yields. Instead, it is a time-for-space process, and the downward trend may be smoother when this process is maintained till next year. Since the market was thin yesterday, and there is space if you insist on short-term trading. However, this is a bad habit which will only weaken your execution. Once the system signals come out, will you stick to the implementation? Self-discipline is important!
Data: The Eurozone manufacturing PMI in November rebounded from the previous 43.1 to 43.7, slightly better than market expectations. But since July 2022, manufacturing activity has been shrinking every month.
Today's focus: U.S. IHS PMI.
Technical Analysis
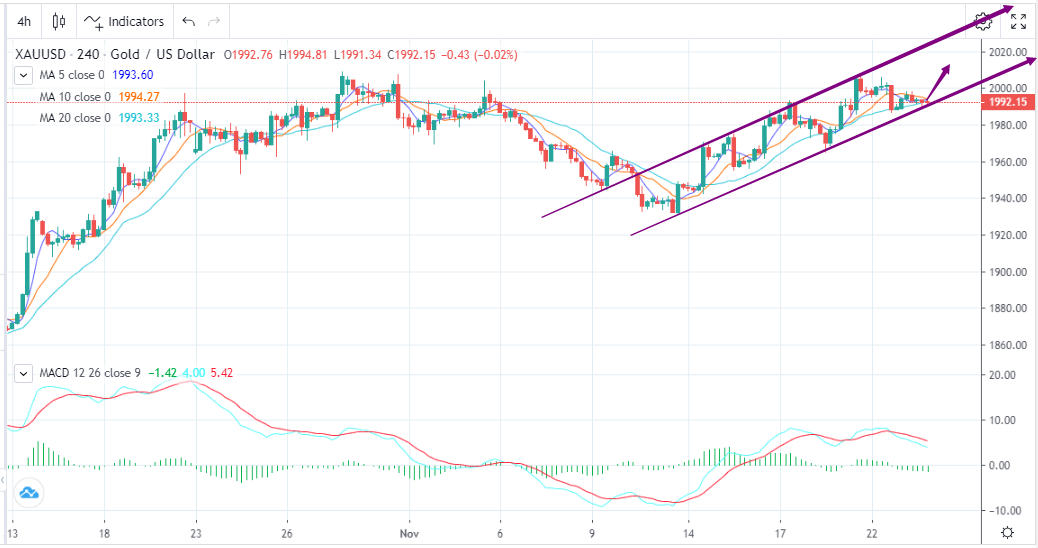
Gold narrowly oscillated yesterday and rebounded slightly at lows, closing the daily chart higher. Regarding the candlestick chart in the 4H chart, gold is running in an ascending channel, and it is near the lower area of the channel after two days of decline. Meanwhile, this area is near the 5-day SMA (1990), and gold is testing the support. If the support is effective, the resistance above will be the channel center, or the previous high (between 2007 to 2009). Moreover, gold may test the resistance at 2024 if it surges further higher. Nevertheless, the ascending momentum is insufficient, and gold will oscillate downward to test the support repeatedly. Worsley, it may depreciate for a short period. For the support below, the initial support will be at 1986, and further support will be at 1972. The trading range will be 1986 to 2007 today, and aggressive investors could buy low and sell high.
Trading Recommendations
Trading direction: Short
Entry price: 2007
Target price: 1987
Stop loss: 2012
Support: 1987.000/1972.000
Resistance: 2009.000/2024.000


