
Chapter 29 Data Maintains Weak and Gold Keeps Strong (11.27)
Fundamentals
During Monday's (November 27th) Asian session, spot gold oscillated narrowly, and it is now trading at 2012. Recent U.S. economic data gets weaker, which also strengthens investors' expectations of the end of the Fed rate hike. It is also expected that the Fed will cut interest rates at the beginning of next year, which dragged down the USDX from 107 (at the beginning of November) to 103. Besides, the November manufacturing PMI was announced in the evening session last Friday, which was accidentally back below the breakeven. Such a surprising result also terminated the weak rebounding USD, while the gold price strengthened and was closed at 2001. In the Asian session today, the gold price opened at highs and directly crossed above the pre-high at 2009, once even reaching 2018. Currently, the pattern suggests a bullish trend without any signals to reach the top. Some investors like to buy lows and sell highs without planning, and ultimately fall in the middle. We won't stop you from selling at highs, but choosing the right time and price is essential. Regarding the situation this week, we should go short in the near term and go long in the long run, as gold is possible to fall from highs. Thus, aggressive investors should go short at highs with small positions and small stop-loss, and stop chasing the growth. If you want to go long, it is important to wait for gold to drop and reach the support level. Meanwhile, patience is particularly important, the fear of missing the trend will always let you go after the rise and fall, and you will finally enter the market in the unsuitable time to enter the market and lose. Now, the simplest way is to establish a trading system or a trading guideline!
Data: U.S. November Markit manufacturing PMI was 49.4, back below the breakeven level. The PMI for the service sector activity expanded slightly to 50.8, a four-month high.
Today's focus: U.S. new home sales for October and Dallas Fed's current general business activity for November.
Technical Analysis
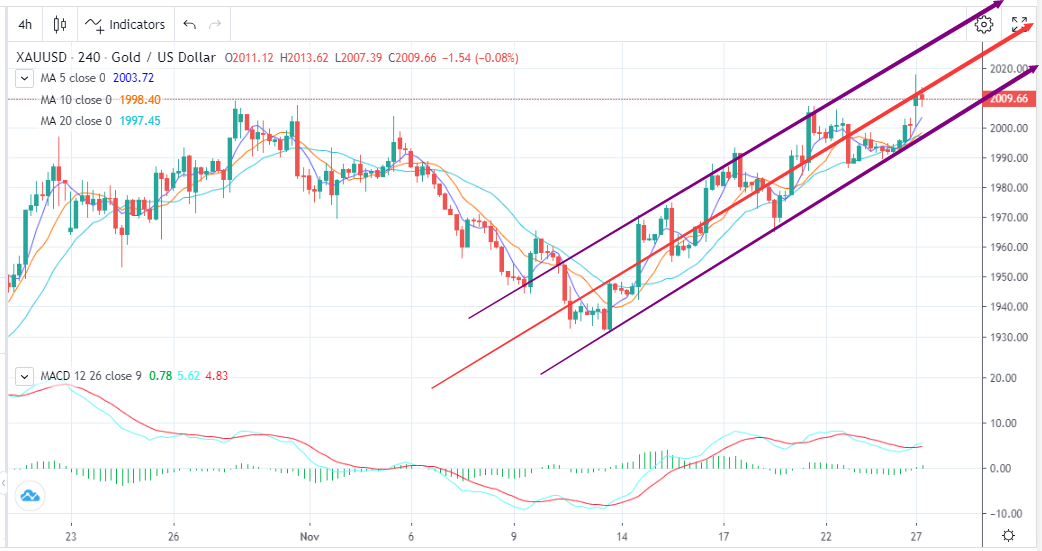
Gold maintained strong during the last trading session and closed slightly higher. It also brought gold a 3-consecutive-day gain with the bulls expanding upward. Moreover, the resistance above is near 2032, and the further level is near this year's high at 2080 without any retracement in the weekly chart. Then, gold keeps a bullish trend in the large cycle. Technically, gold is running in the candlestick chart of the 4H chart, and it will test the resistance of the middle line as we explained last Friday. Furthermore, MACD enters the overbought zone and approaches the previous high, showing that the current gold trend is still strong. However, the gold bears are also actively resistant, and gold may fall from highs at the beginning. Therefore, gold should retrace in the hourly chart, and the support below will be in the range from 1997 to 2000 with the lower support in the range between 1980 to 1985. Today, gold will move from 1998 to 2020, and aggressive investors should buy low and sell high in this range.
Trading Recommendations
Trading direction: Short
Entry price: 2020
Target price: 1998
Stop loss: 2025
Support: 2000.000/1985.000
Resistance: 2020.000/2032.000


