
Chapter 31 A Slight Pullback in the US Dollar Boosts Gold Prices (11.28)
Fundamentals
During the Asian session on Tuesday (November 28), spot gold fluctuated in a narrow range and is currently trading around 2015. Sales of new US homes fell more than expected in October, again indicating the US economy is gradually weaker. The market continued to trade an early Fed's rate cut, which sent the dollar index and US bond yields lower, boosting gold prices. Gold fluctuated by $18 yesterday in the range of $2000-$2018, but the trading opportunity came only after the release of the US data. After surging and then falling back to $2005 in the Asian session, gold prices rallied to the intraday high of $2018 in the US session. Investors who took the opportunity to go long perhaps could make some profits. Recently, the market has been trading weaker economic data and interest rate cuts, but we should know it's not the right time yet. While the current bond supply and demand imbalance has eased under speculation, it doesn't change materially. High-interest rates are likely to stay longer. Thus, we maintain the view that gold prices will fluctuate widely this year and the beginning of next year, and will seek to break through the second half of next year to hit new highs. At present, the gold price still has no effective breakthrough stage of the double top resistance, investors can take a small position to try to go short!
Data: US annualized New home sales in October were 679,000, with an expectation of 723,000. The median price of new homes was $409,300, which was the lowest since August 2021, down 17.6% YoY. New home inventories rose for the third straight month in October to their highest level since January this year. US mortgage rates peaked at a multi-year peak of about 8% in October, and last week's Freddie Mac data showed that US 30-year term mortgage rates fell for the fourth consecutive week at 7.29%.
Today's focus is on the US FHFA home price index for September, the consumer confidence index for the November consultation meeting, and the FOMC members' speech.
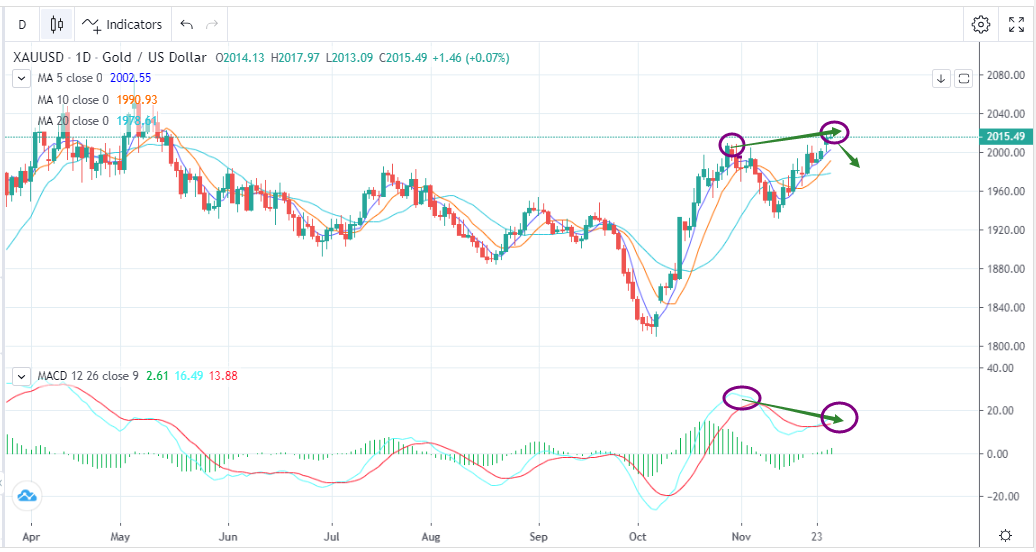
Technical Analysis
On the trading day, the gold price continued to strengthen, closing a small bull candle, and fluctuating in the 4-hour operation of the center of the upper position of the shock. Currently, from the 1-hour and the daily chart, there is a bearish signal of the top divergence, which makes it difficult to maintain bullish during the day. Gold prices may have hour-level pullbacks, and then see if they can drive the daily chart to pullback. If the daily candlestick closes a bearish candle, it basically announces the short-term end of this wave of rally. In the market ahead, investors can try to go short at high with small positions but should not chase the market. Today's operation refers to the range of 1998-2018. Traders can buy low and sell high within the range.
Trading Recommendations
Trading Direction: Short
Entry Price: 2018
Target Price: 1998
Stop Loss: 2023
Support: 2000.000/1985.000
Resistance: 2020.000/2032.000


