
Chapter 12 2023.9.22 欧盘小时线图 技术分析
2023.9.22 欧盘分析
EURUSD
欧元兑美元连续两天呈现金针探底走势。
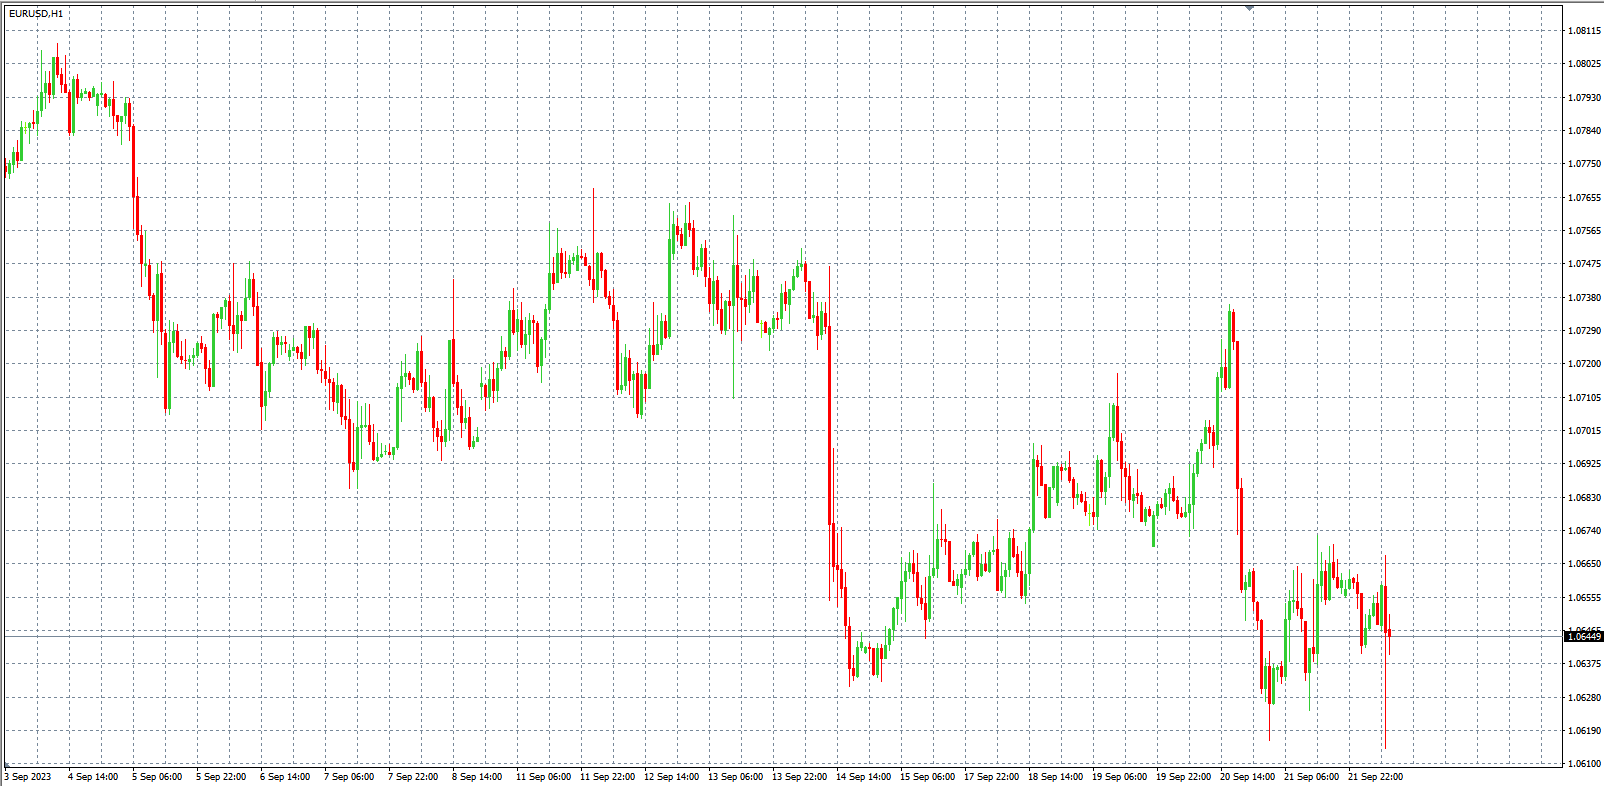
欧元兑美元大概率走强。
压力位: 1.07000,1.07800
支撑位: 1.06100,1.05500
GOLD
黄金在日线级别多空分水岭附近展开多空争夺。
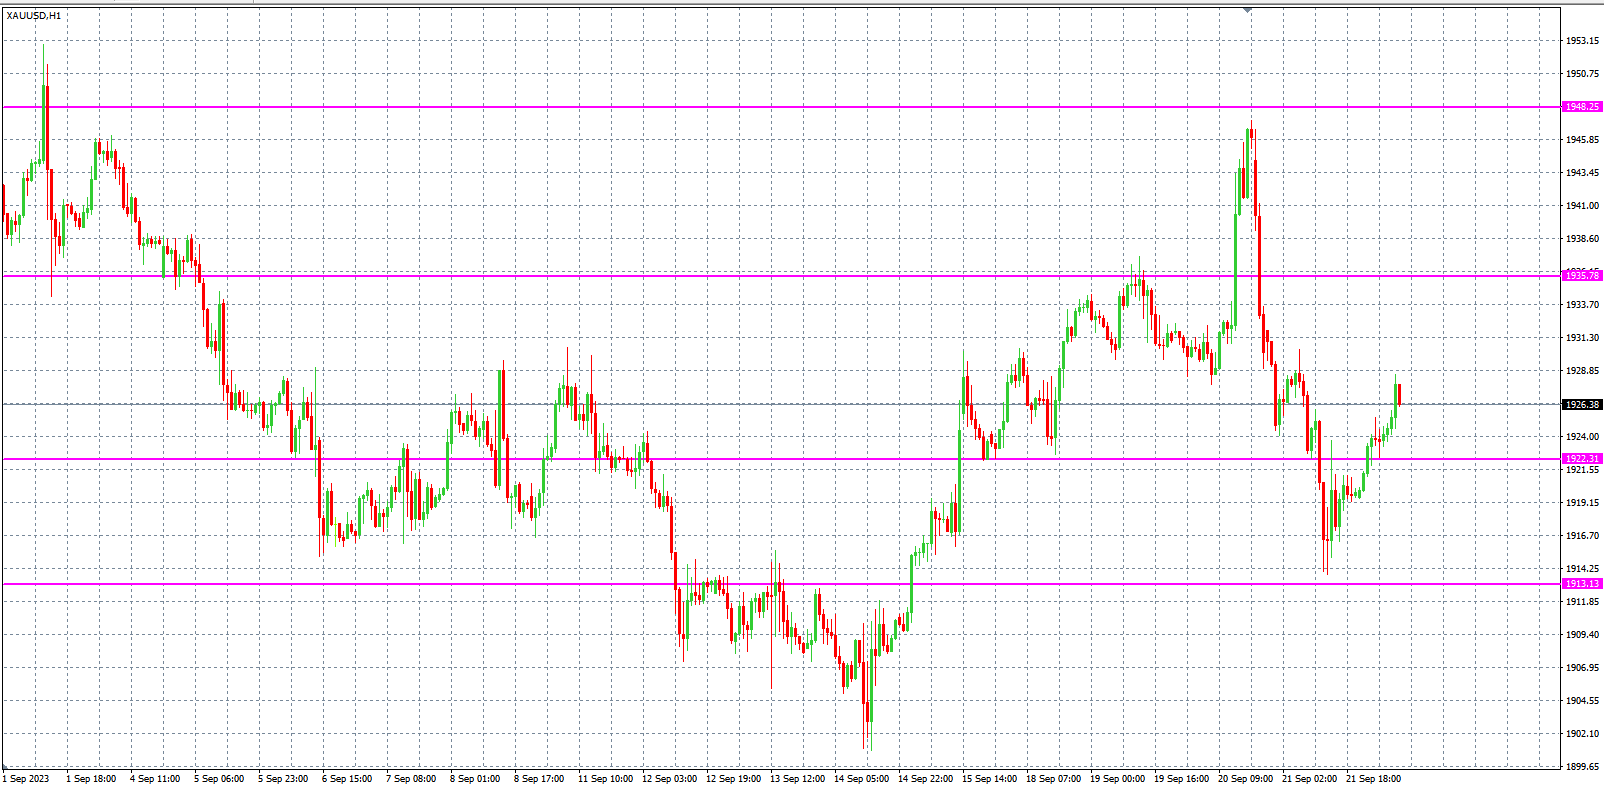
我们预计,今天金价大概率继续在1892-1919-1942大震荡。
压力位: $1,935,$1,942,$1,951
支撑位: $1,925,$1,919,$1,903
GBPUSD
英镑兑美元小级别头肩底形态明显。
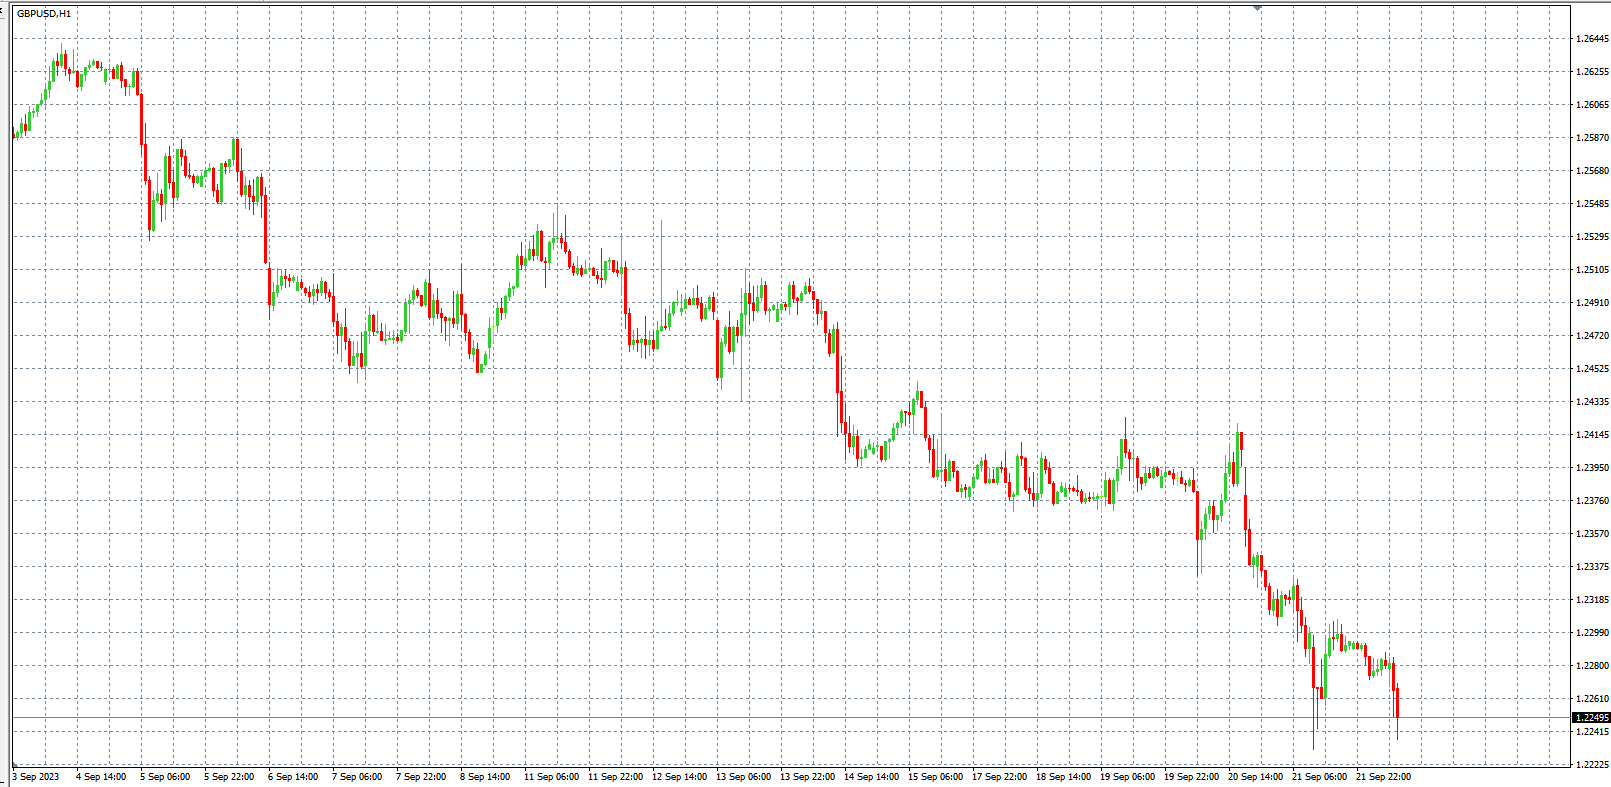
我们预计英镑兑美元将创近期新低后,快速反弹,最终回归缓慢上涨的形态。
压力位: 1.23200, 1.23900
支撑位: 1.22100, 1.21600
SPXUSD
标普持续下跌,但依然在之前的震荡区间内部。
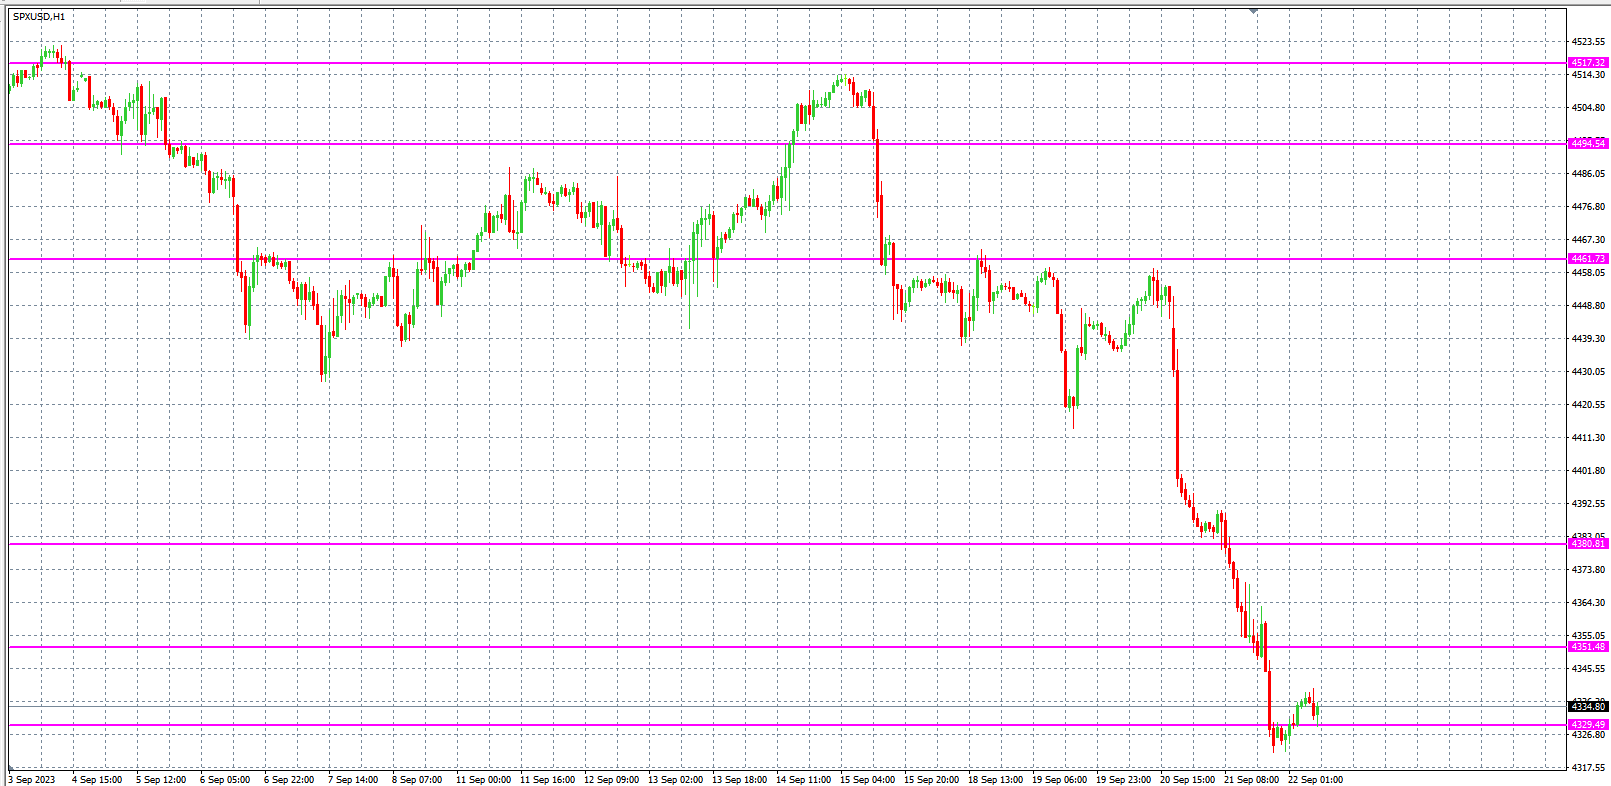
我们预计标普大概率继续下跌!
压力位: 4390, 4460
支撑位: 4310, 4250
USOUSD
美原油呈现相对高位震荡整理走势。
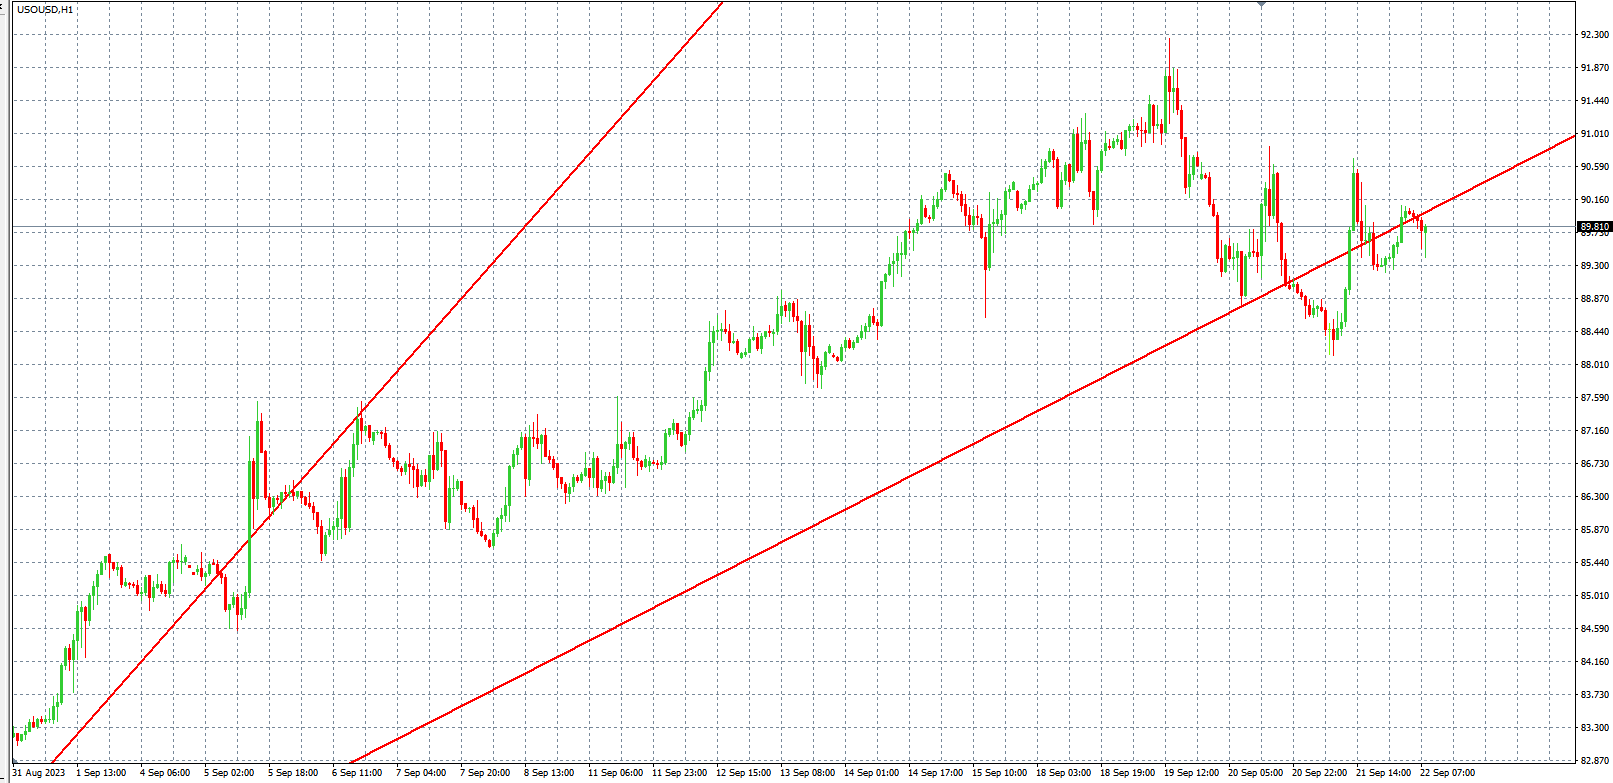
我们预计,美原油大概率缓慢走低。
压力位: 90.3,91.9,92.6,93.7
支撑位: 88.5,87.6,85.5,83.6


